
Database Dashboard Set Up
Database Dashboards let you turn TRIFFT's raw data (users, transactions, coupons, wallets, and more) into visual reports you can monitor over time - without needing SQL or a separate BI tool. A dashboard is built from one or more Questions, each of which queries a specific data object (e.g., Transactions, Users) and lets you filter, summarize, and group the results into a chart or table.
The typical workflow is:
- Create a dashboard (a container for your reports).
- Add one or more Questions to it - either reuse existing ones or build new ones by choosing a data object, applying filters, and summarizing/grouping the data.
- Adjust each Question's chart type and display settings.
- Save and arrange your Questions on the dashboard.
This article walks through both steps - creating a dashboard and building Questions for the most common use cases (new user registrations, transaction totals, coupon activity, wallet balances, and more).
To create a Dashboard, you need an account with access to the "Analytics" tab. By default, two people in each company have this access. If you don't have it, please contact us, and we'll check who currently has access.
Create a new Dashboard
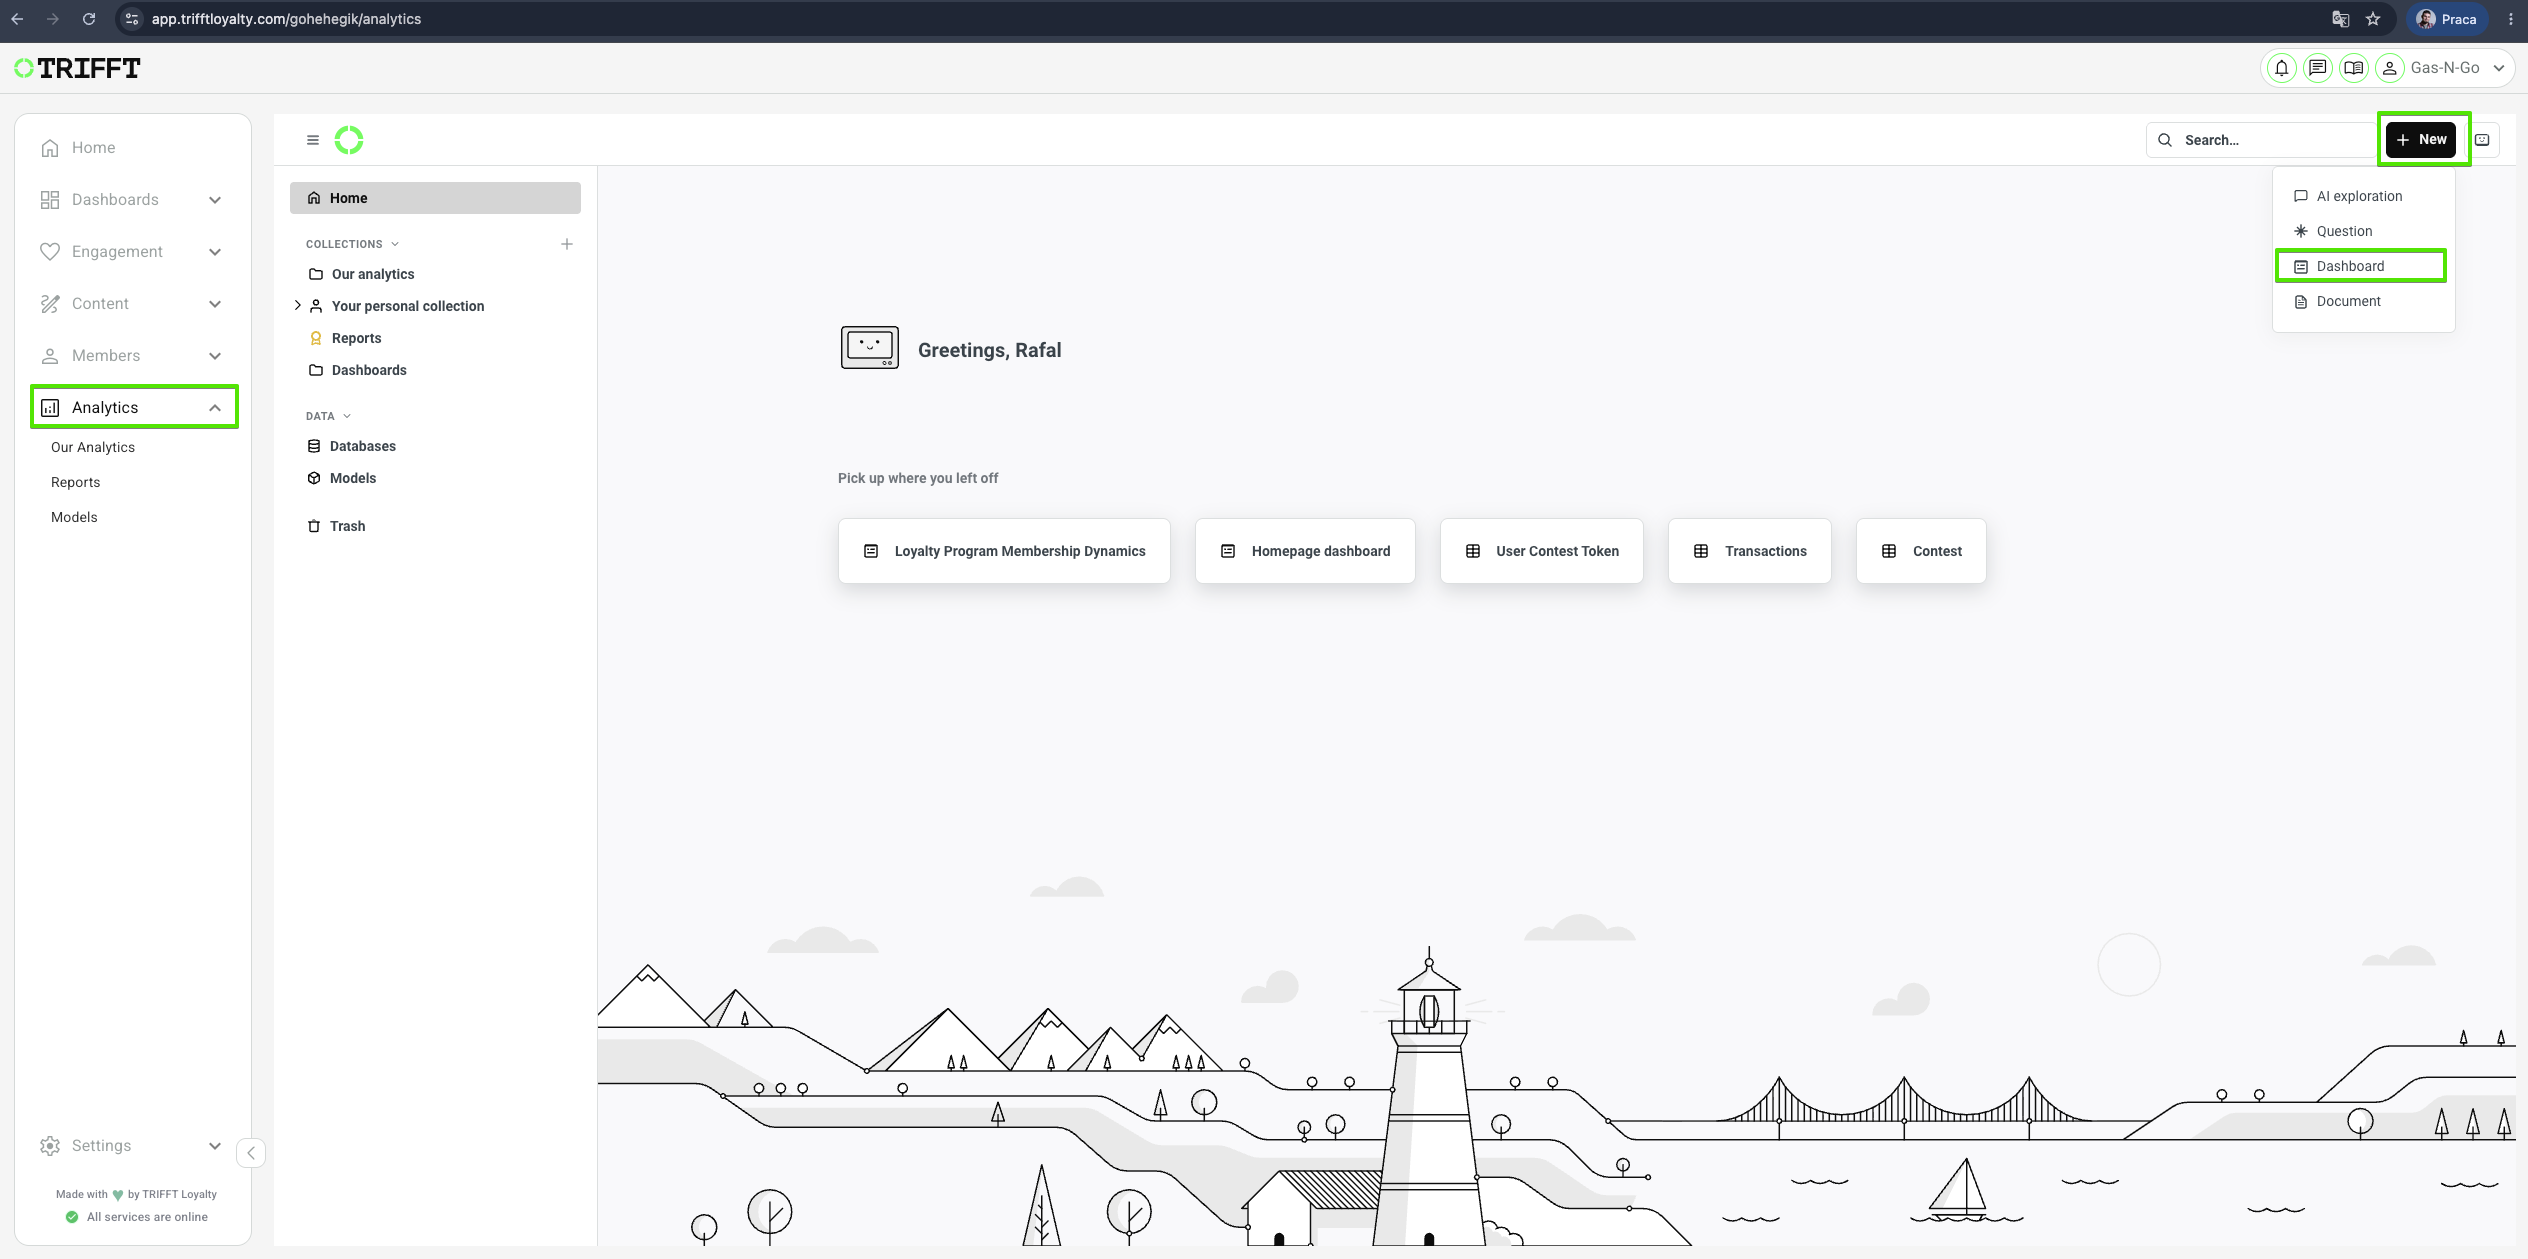
To create a new Dashboard, go to Content Cockpit > Analytics > +New > Dashboard
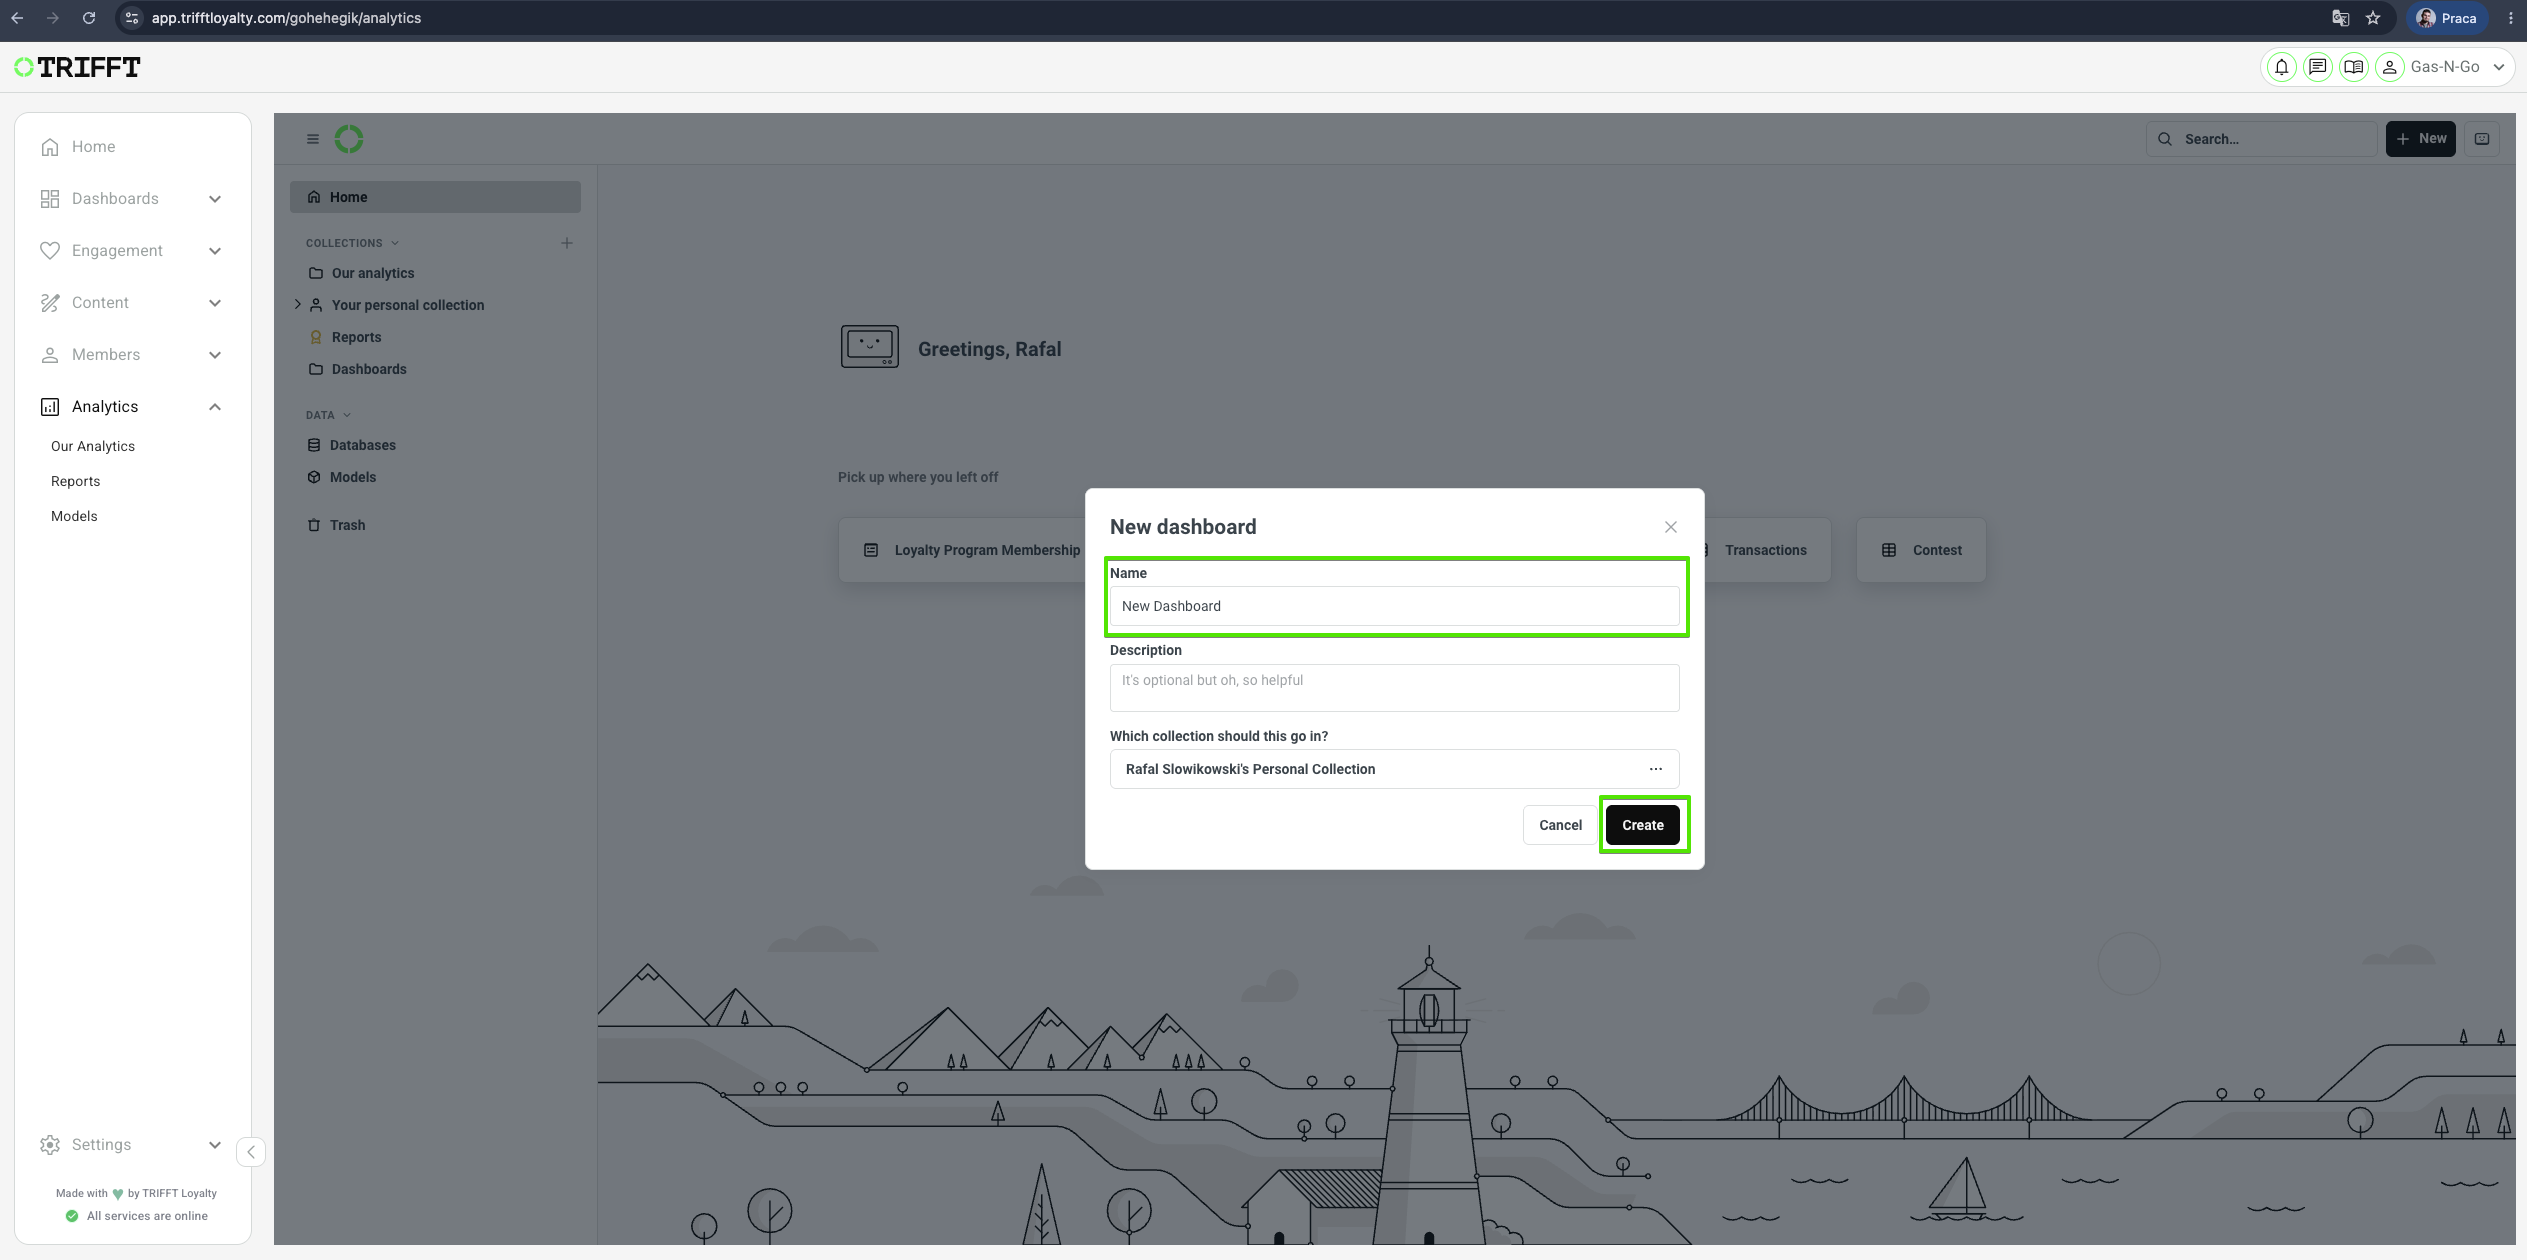
Enter the Name (required), Description (optional), choose where you want to save it, and click Create.
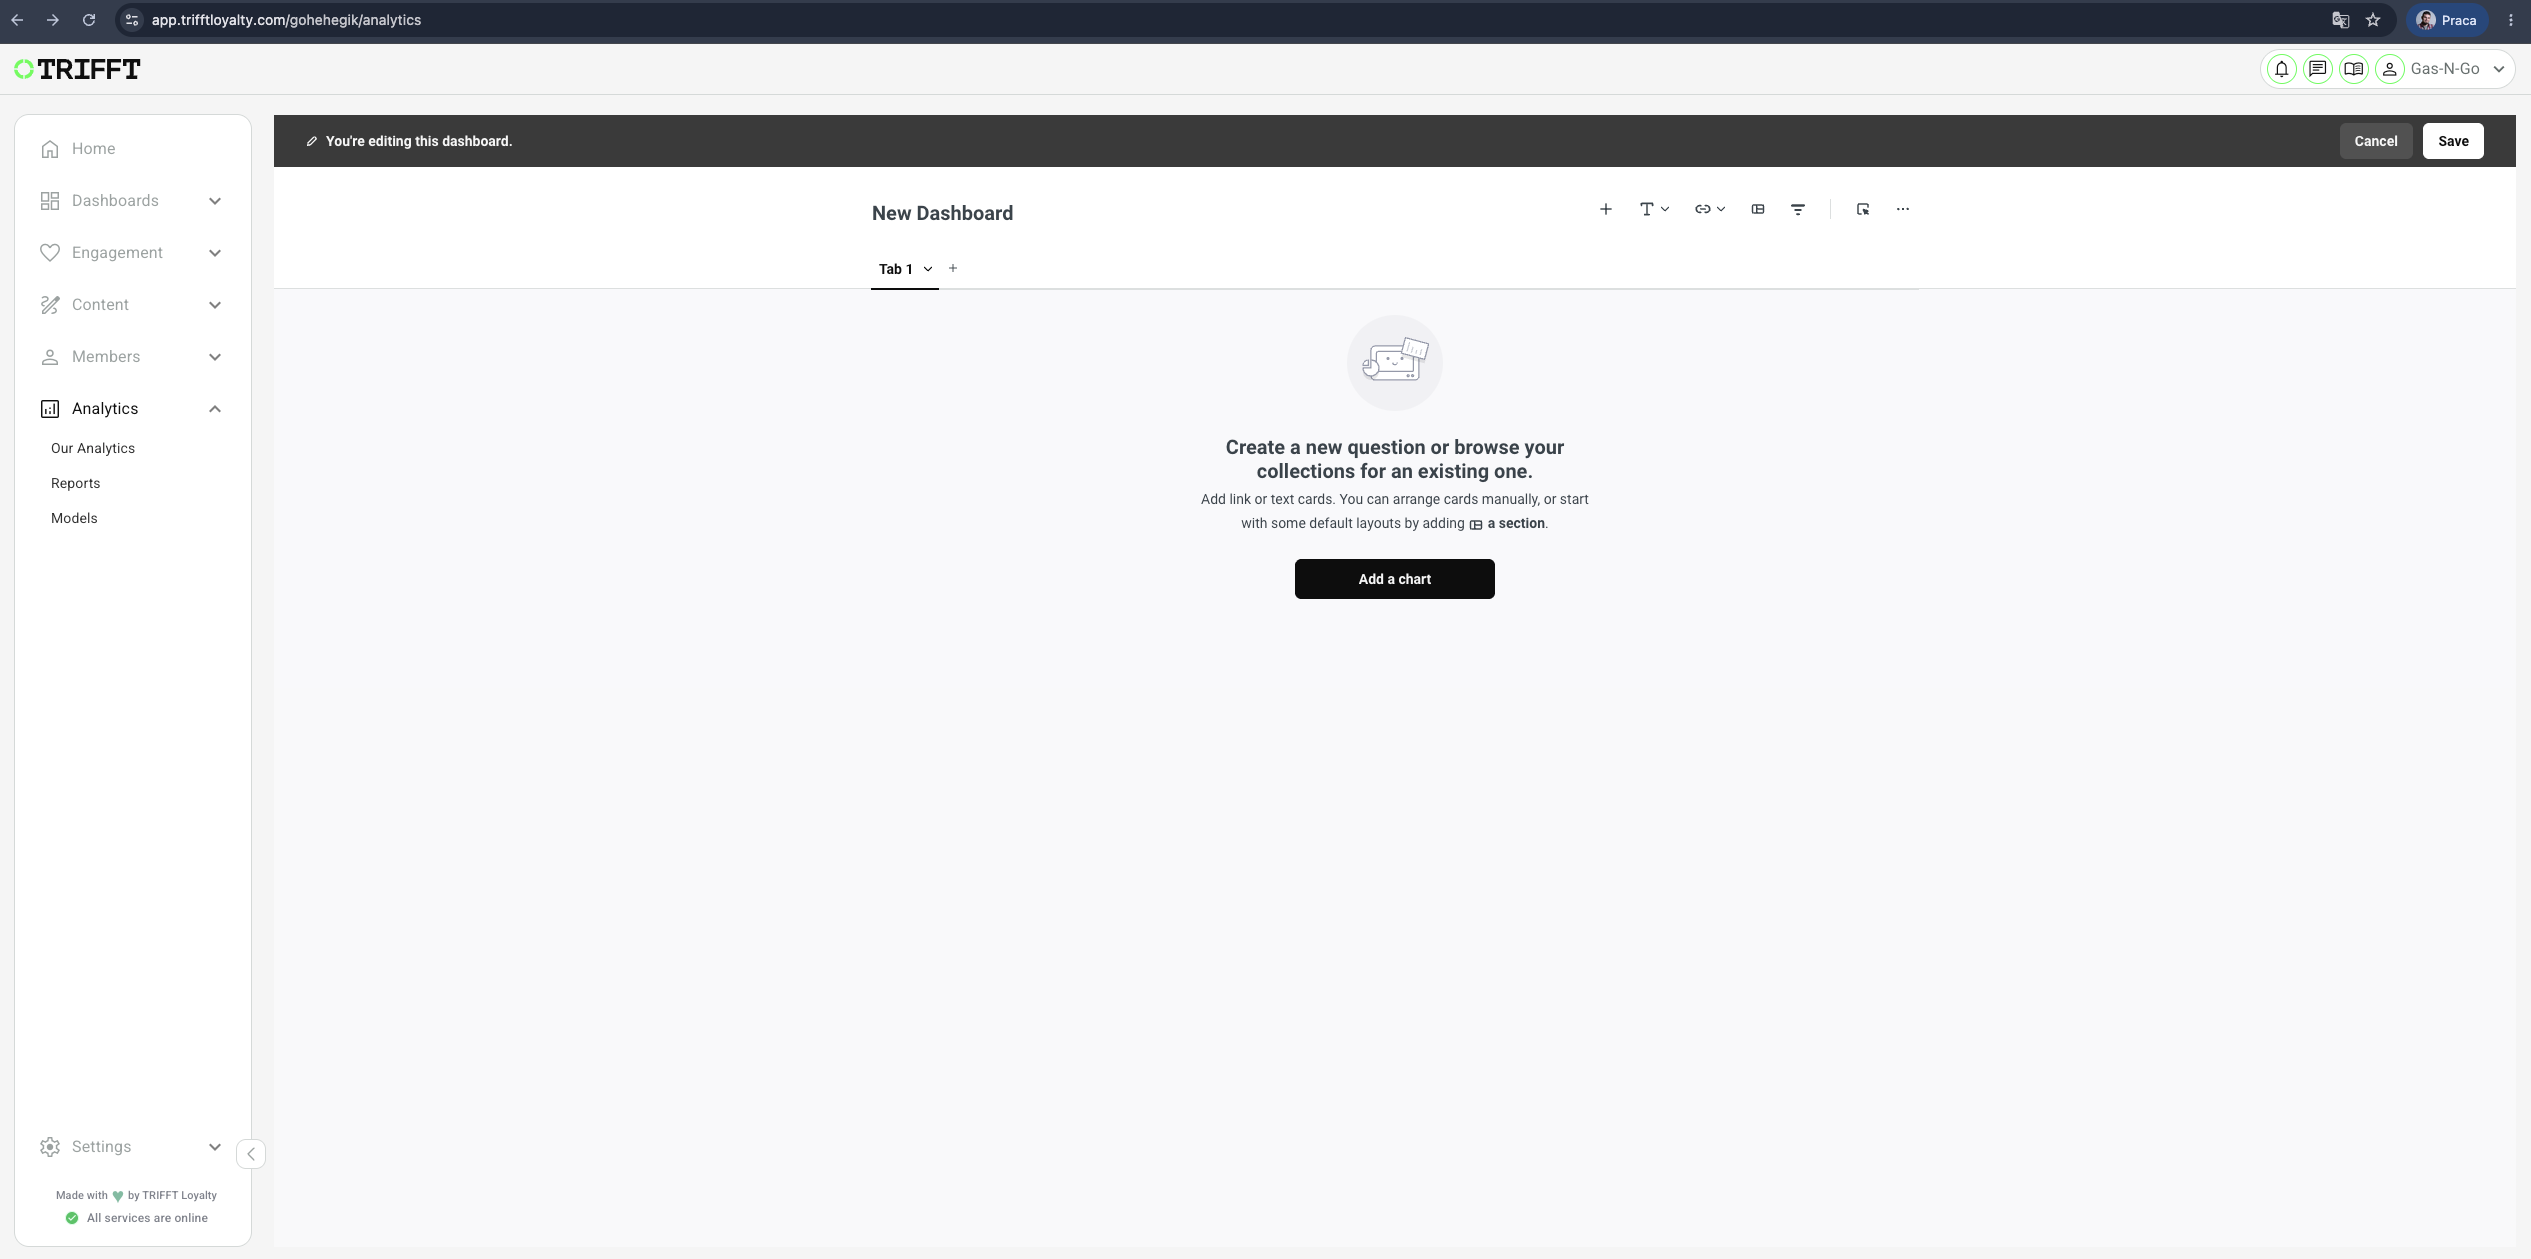
Now you are in edit mode:
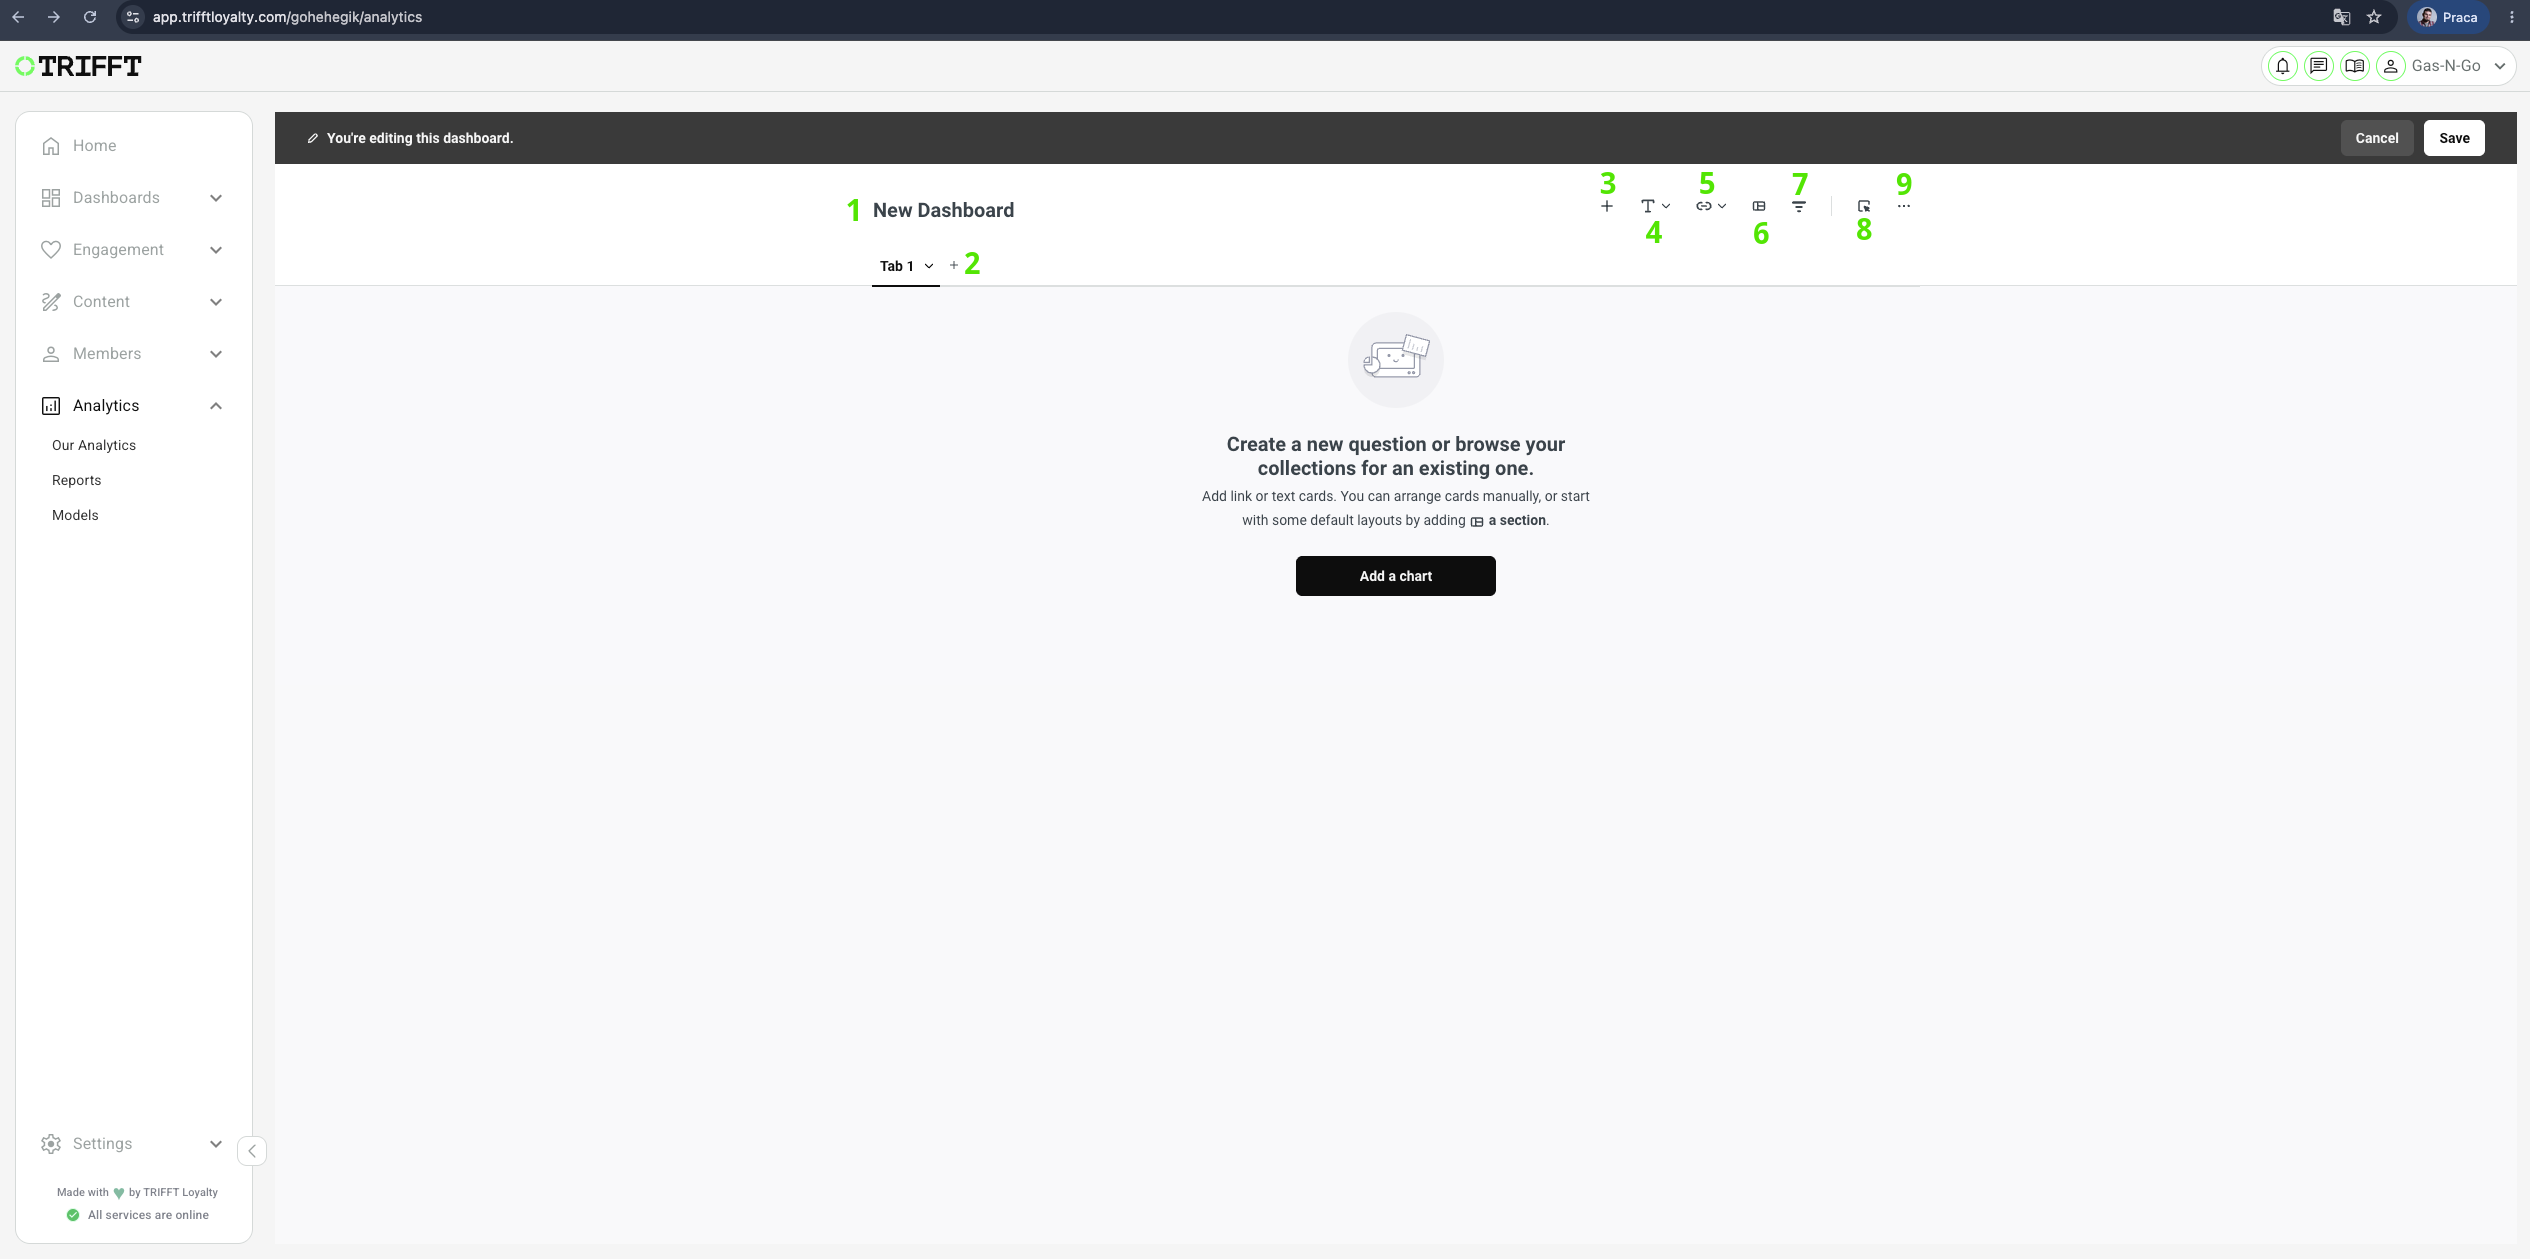
Available edit options:
- Name
- Add Tab, Duplicate Tab, Rename Tab, Delete Tab
- Add questions (you can use previously created or create a new one)
- Add heading or text
- Add a link or iframe
- Add section
- Add filter or parameter (Date picker, Time grouping, Location, Text or Category, Number, Boolean, ID)
- Add action button
- Toggle width (Full width)
Example of Dashboard view with Questions added:
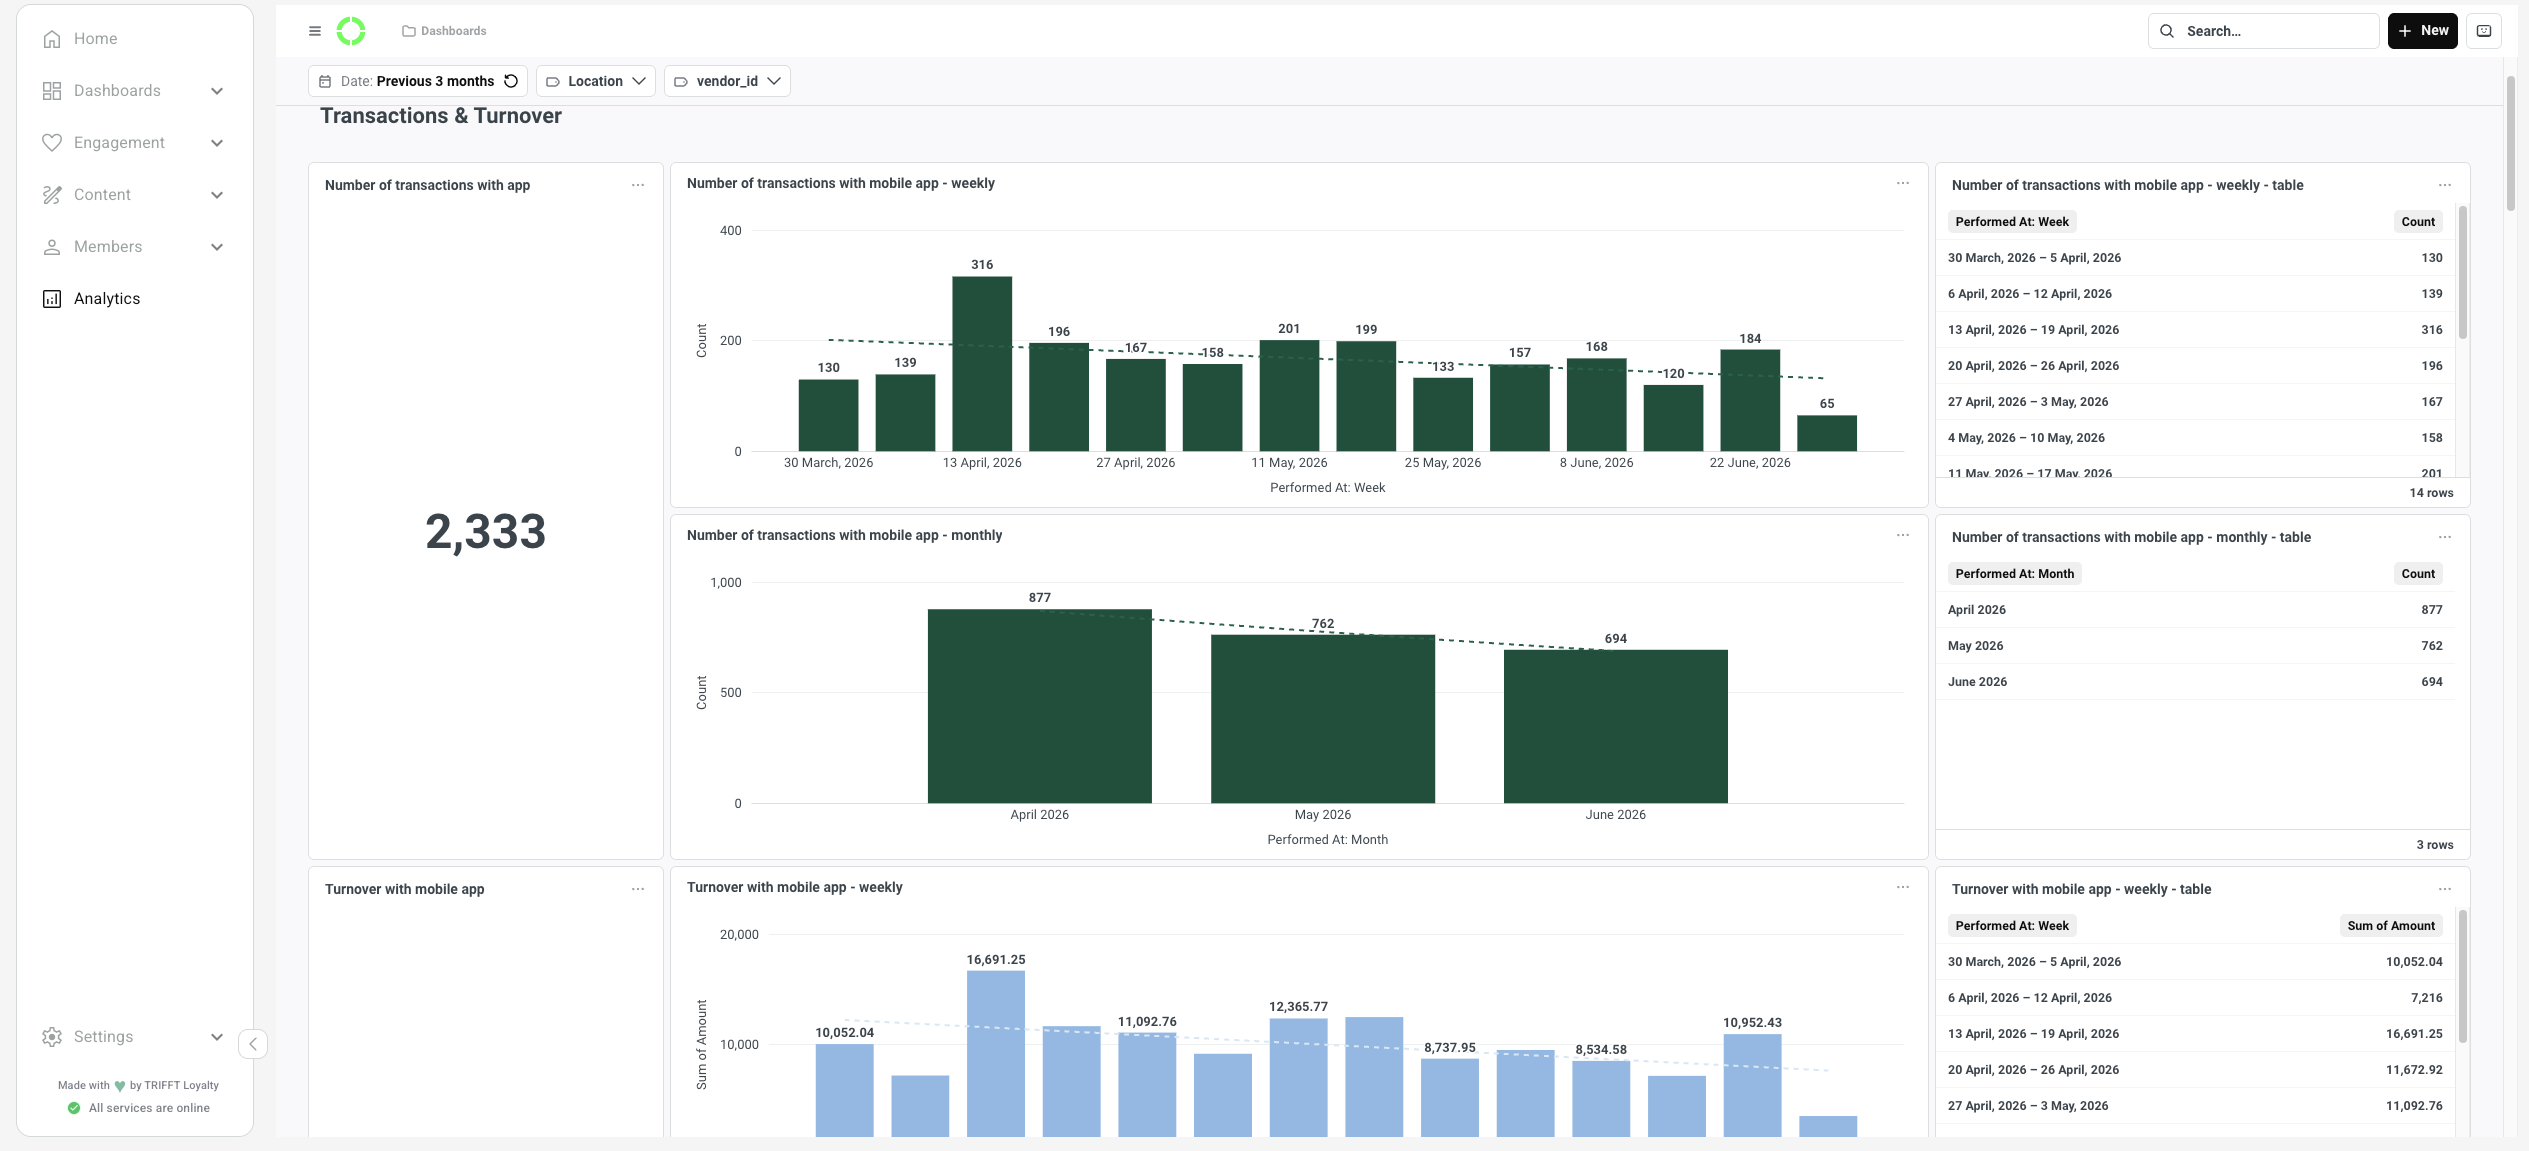
Questions use cases:
To create a Questions go to Analytics > Databases > Production
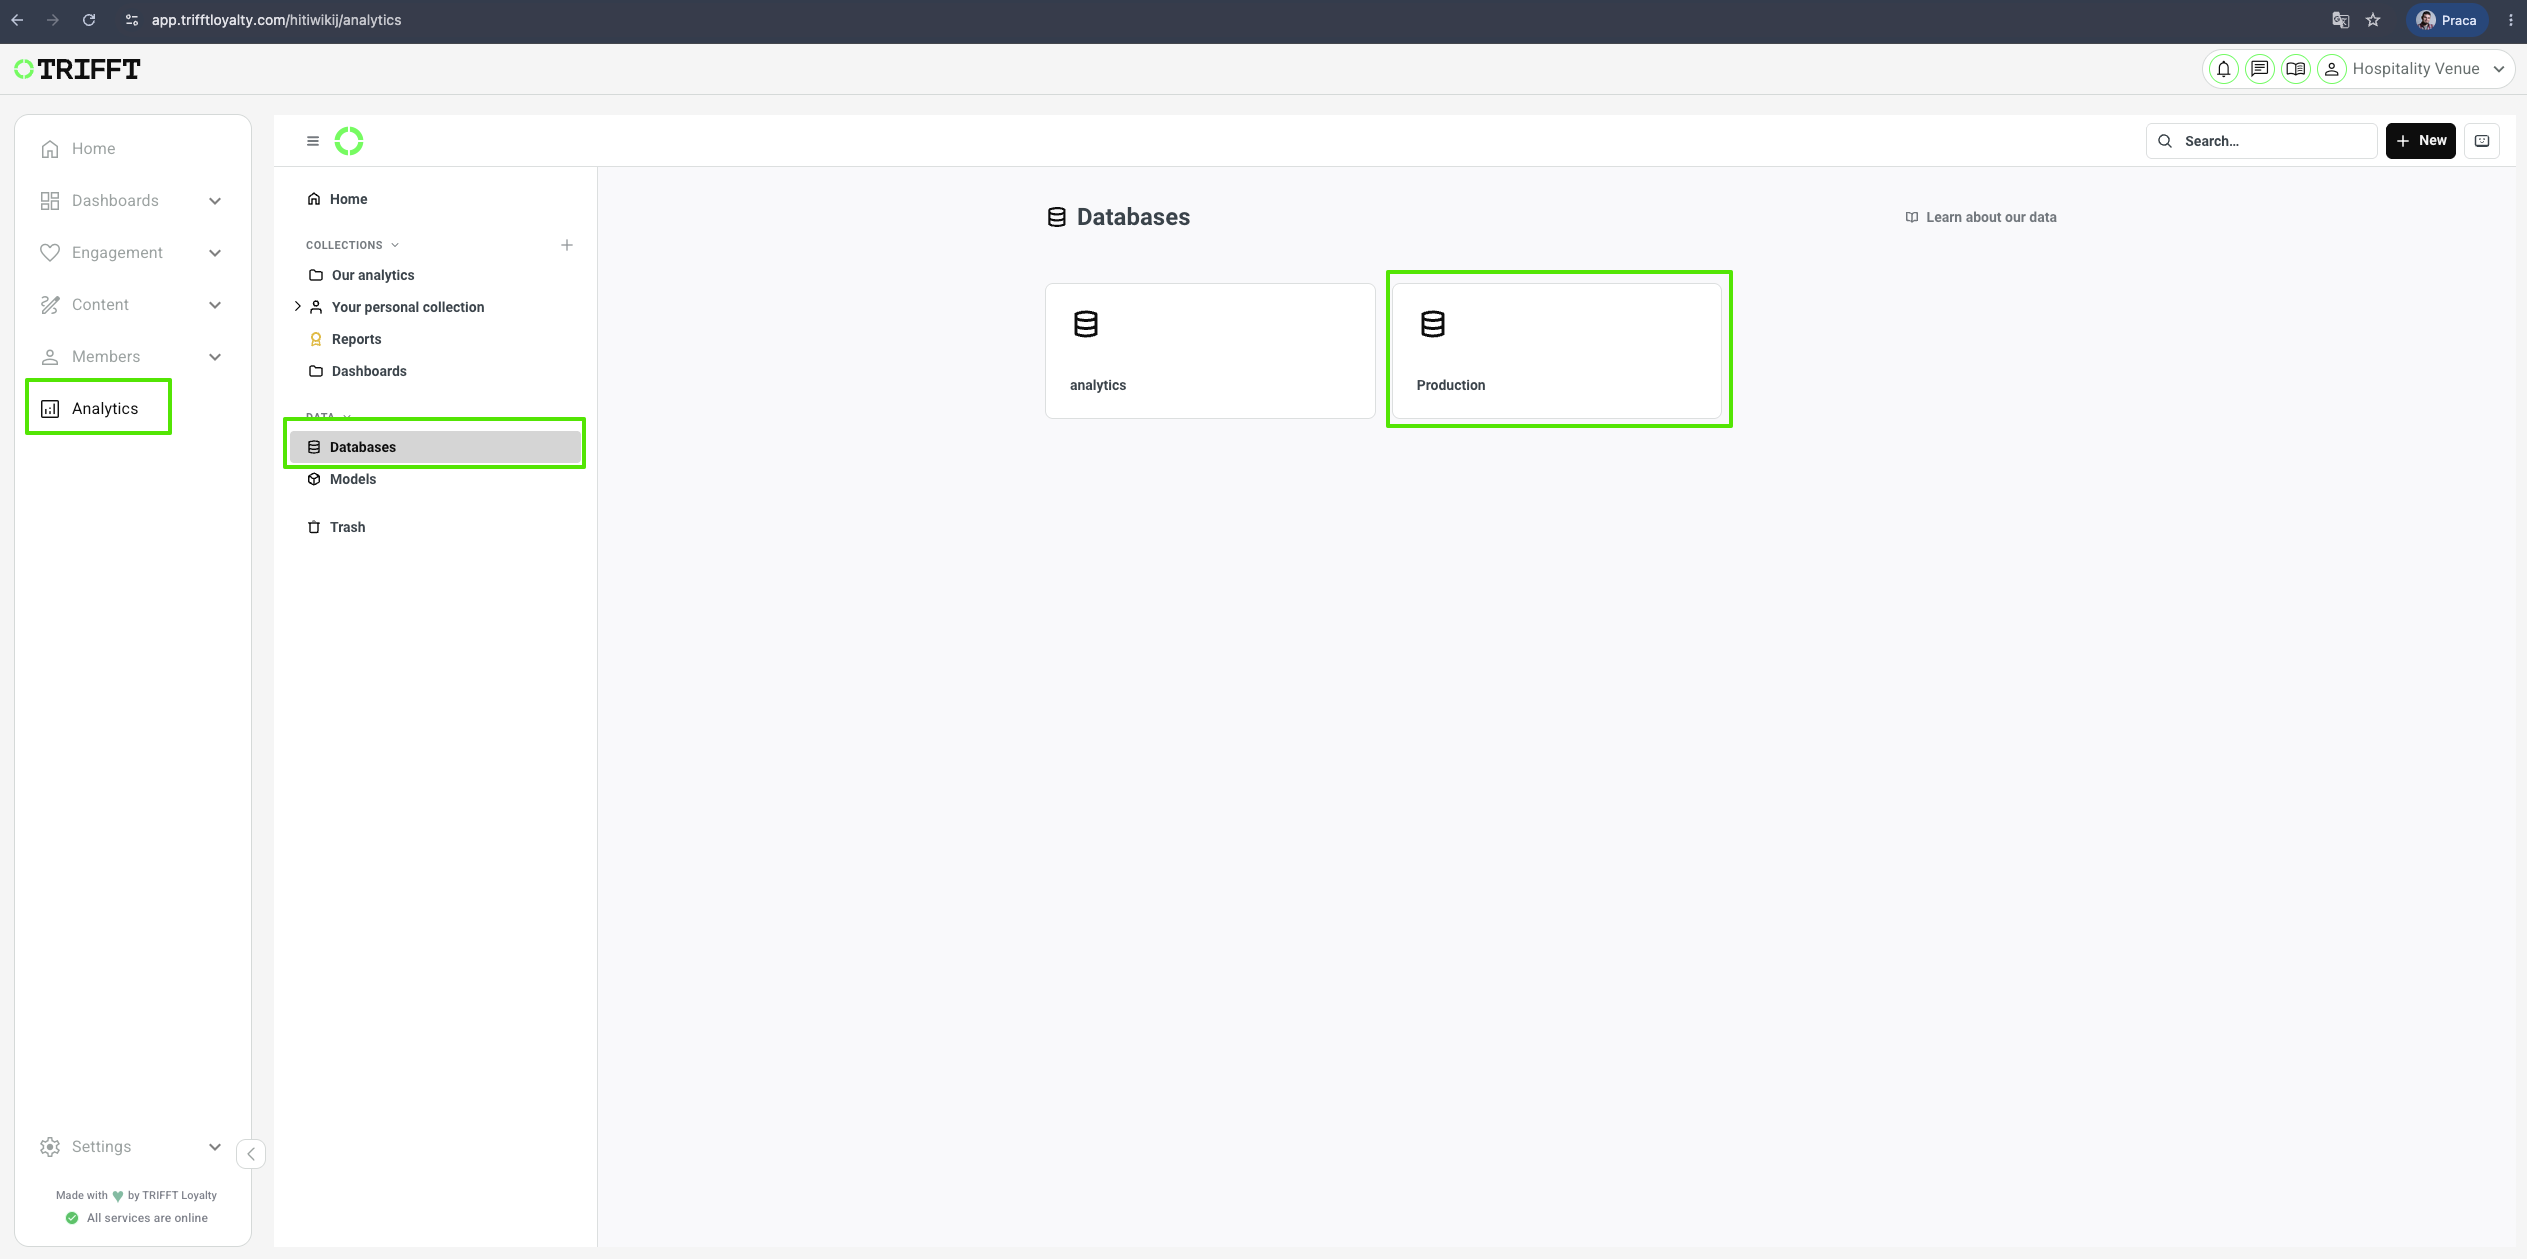
From there you can choose multiple options as below:
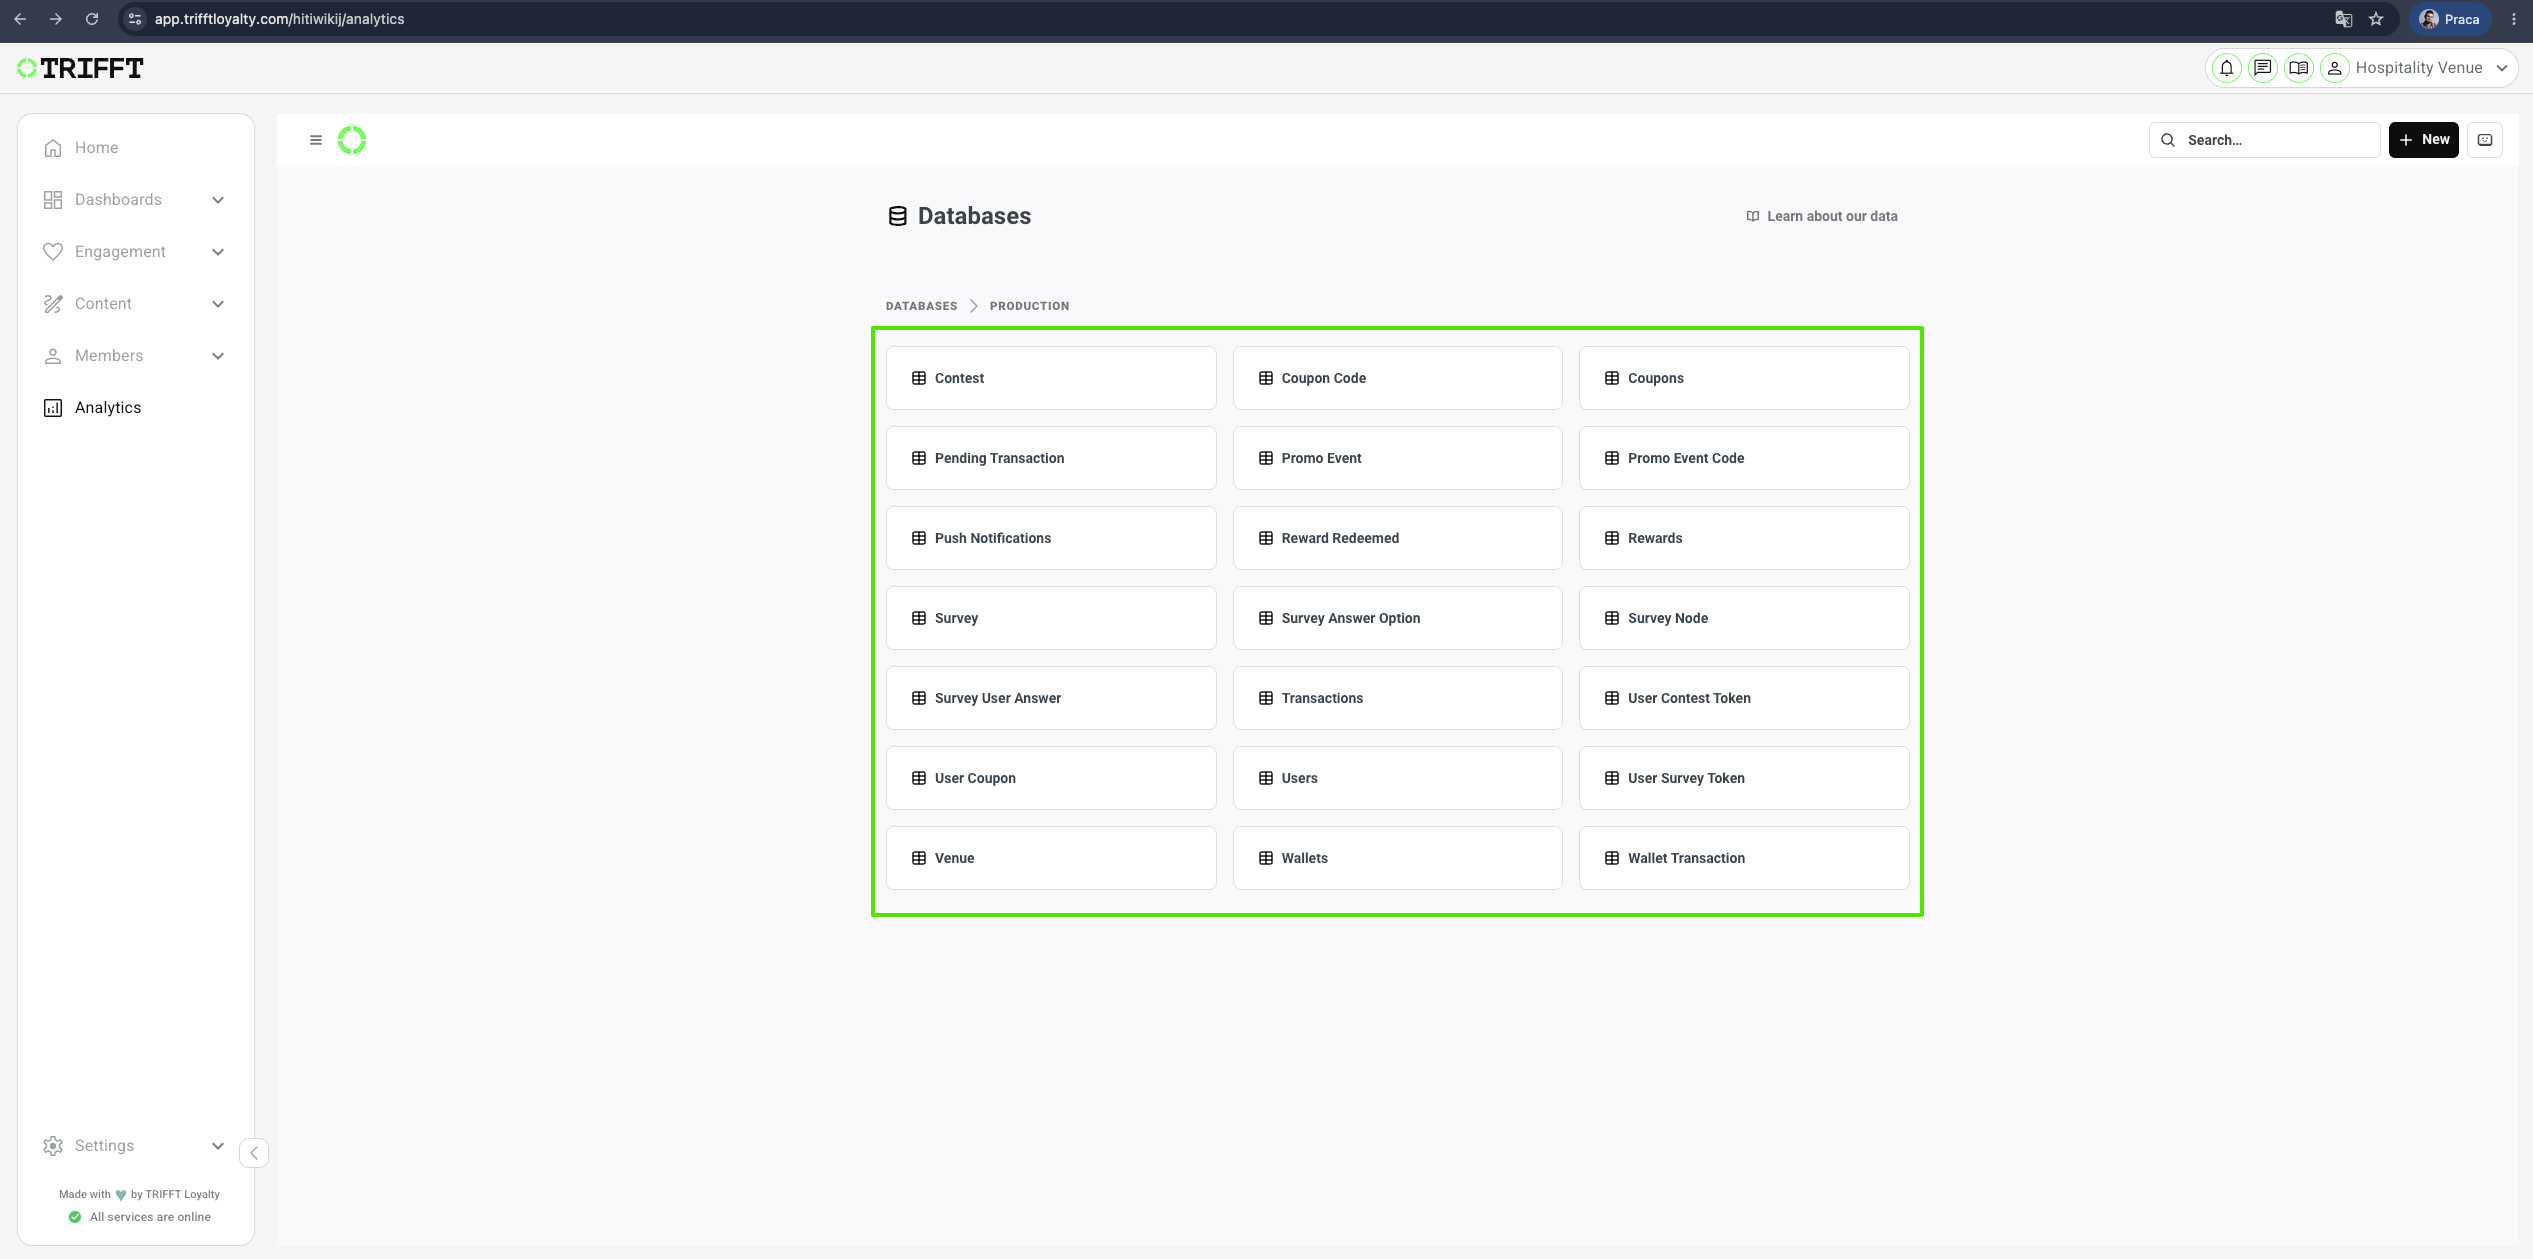
- Contest
- Coupon Code
- Coupons
- Pending Transaction
- Promo Event
- Promo Event Code
- Push Notifications
- Reward Redeemed
- Rewards
- Survey
- Survey Answer Option
- Survey Node
- Survey User Answer
- Transactions
- User Contest Token
- User Coupon
- Users
- User Survey Token
- Venue
- Wallets
- Wallet Transaction
Users registrations (New users):
To create a Questions go to Analytics > Databases > Production > Users
Apply filters like for example: 1 "Is Active = True" + 2 "Is Verified = True". Active filters are shown
here 3 and can be removed by clicking x

Click 1 Summarize and choose in Summarize by: 2 "Count", in Group by 3 "Created At"(here you can choose to group it by: Minute, Hour, Day, Week, Month, Quarter, Year)
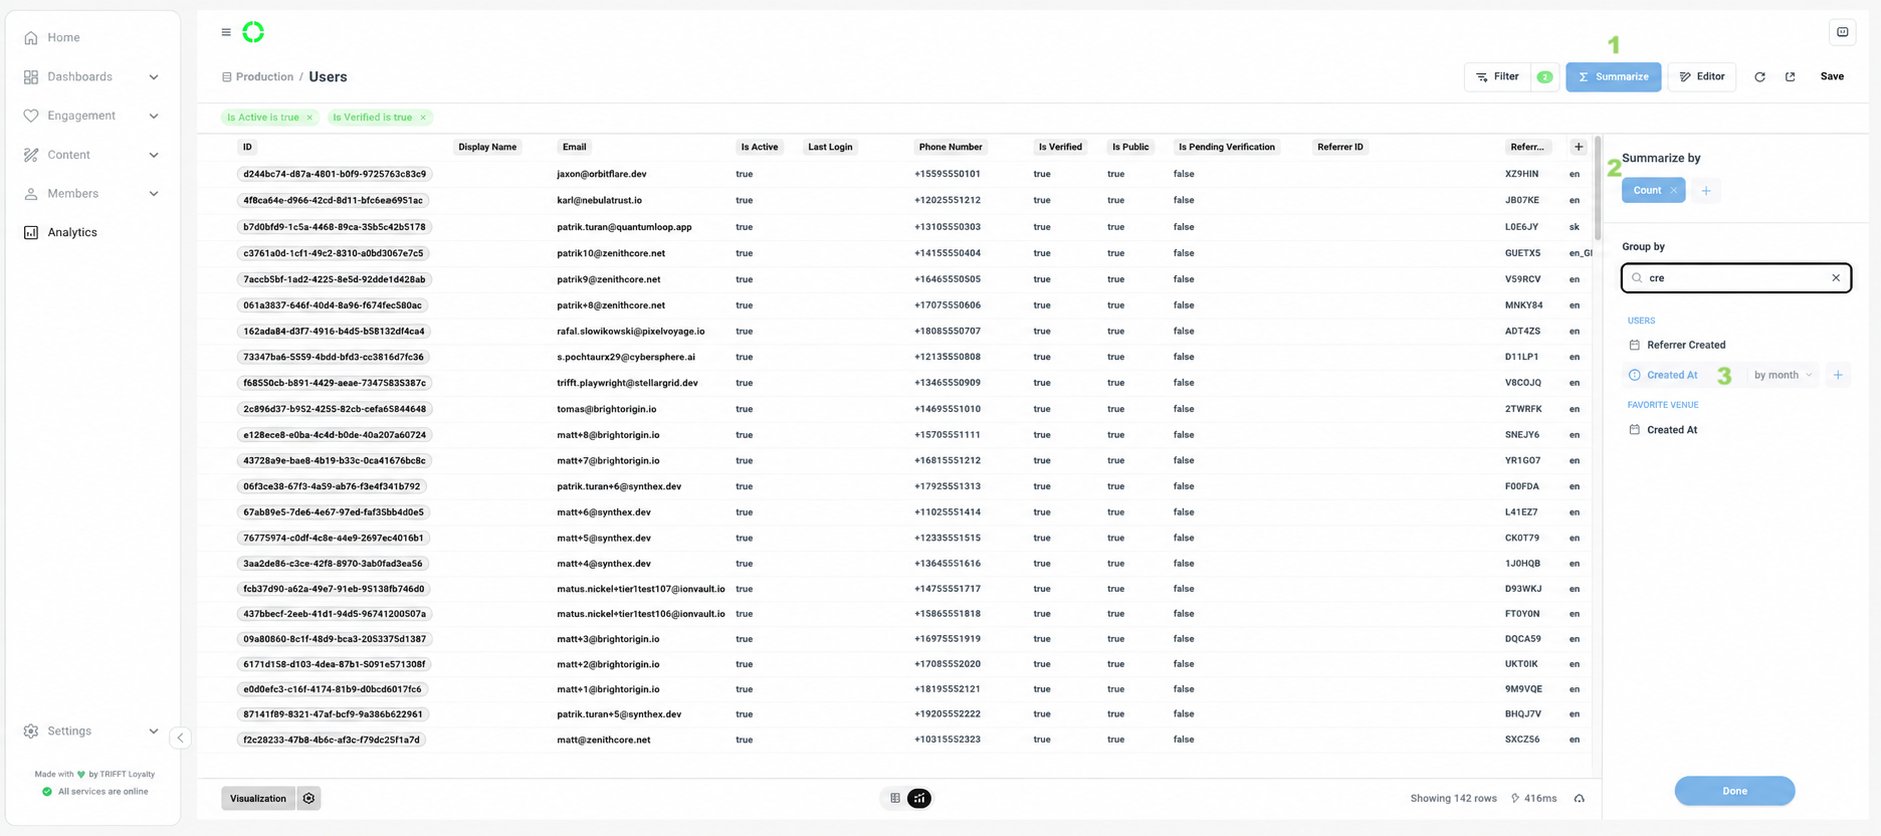
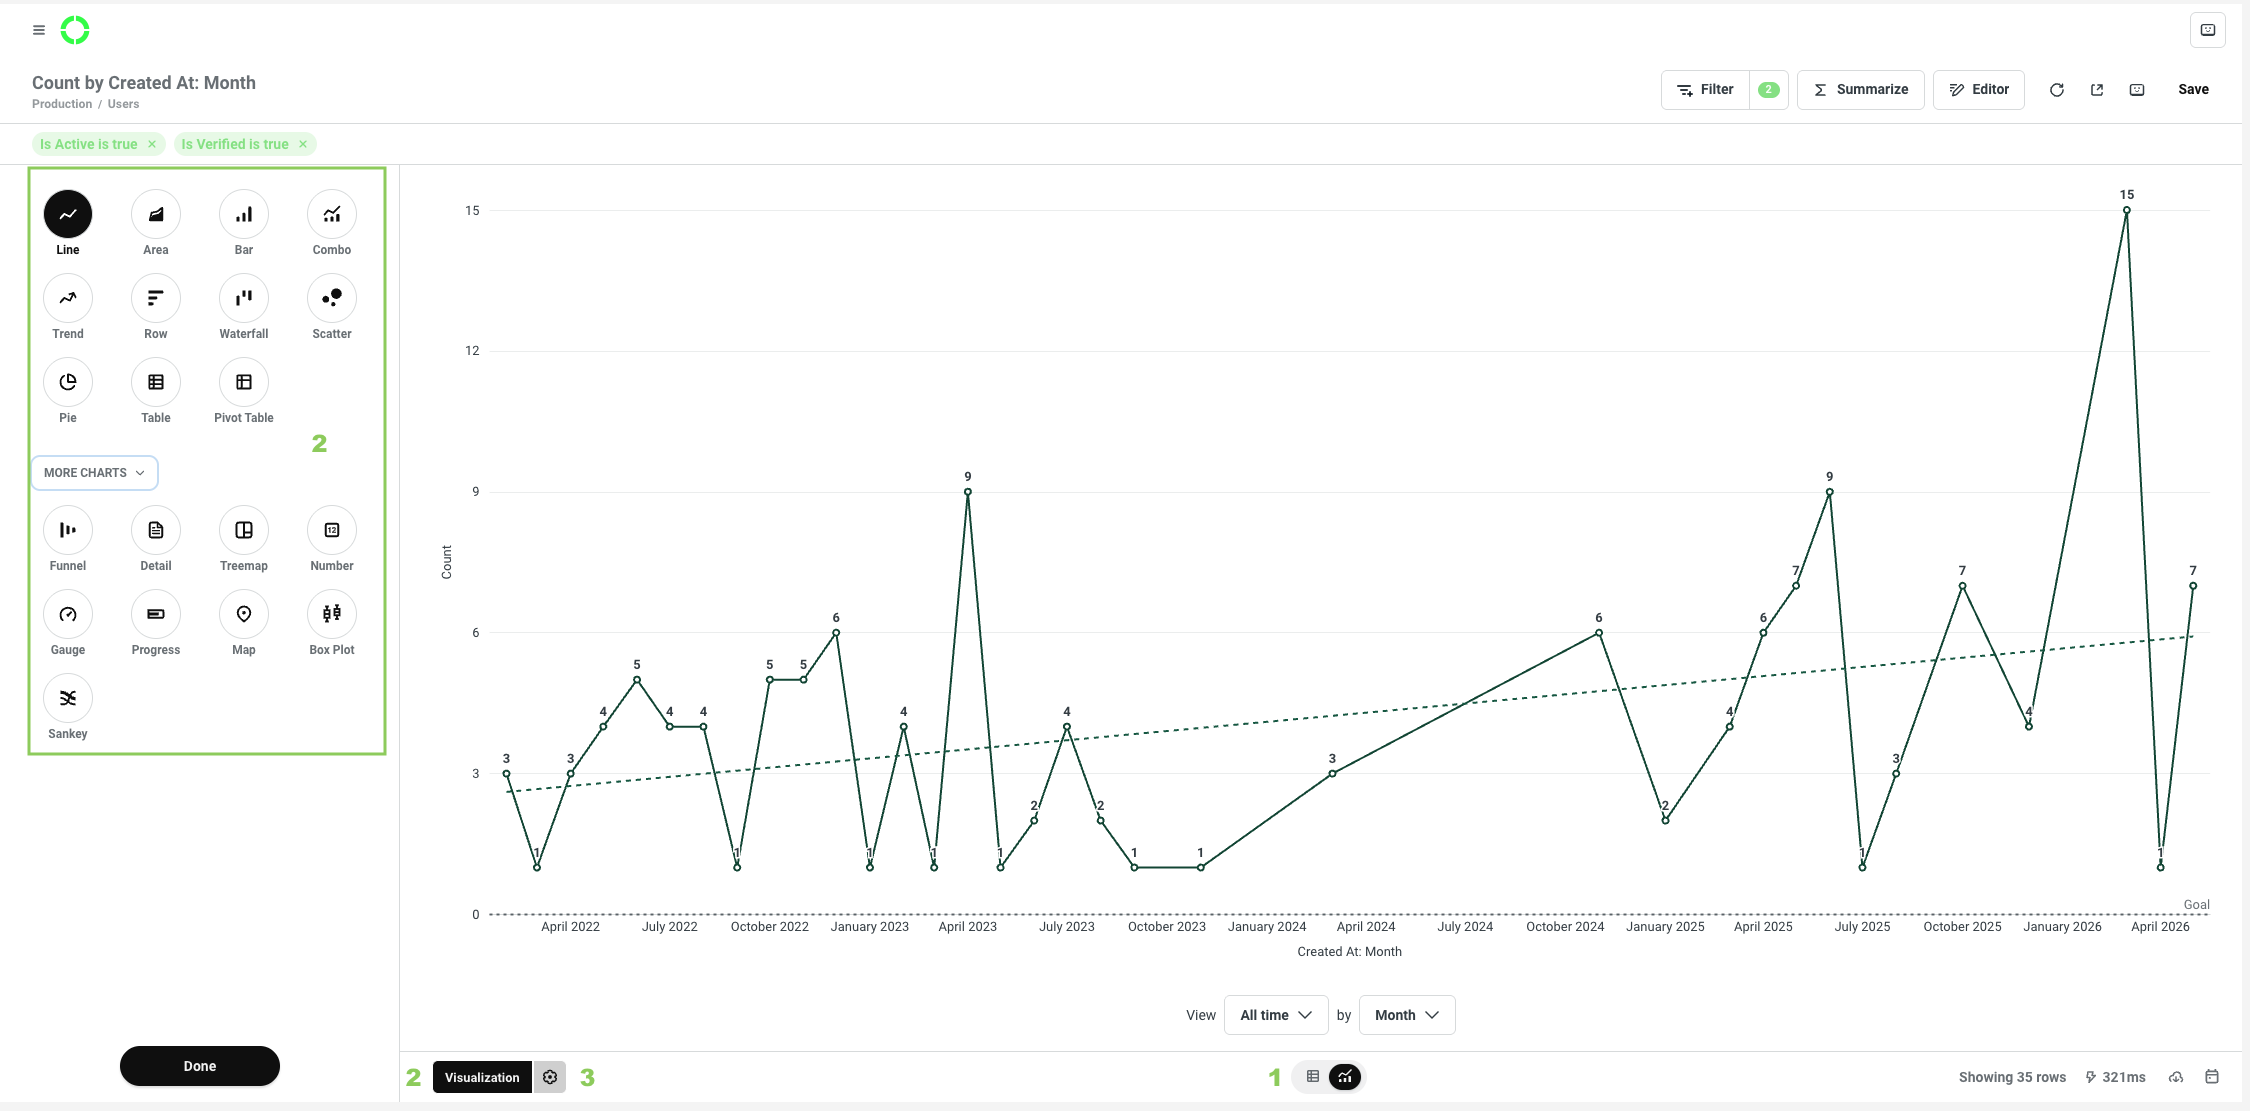
When you choose your "Group by" you will get a preview of the data on a chart. From here you can adjust visual and display settings:
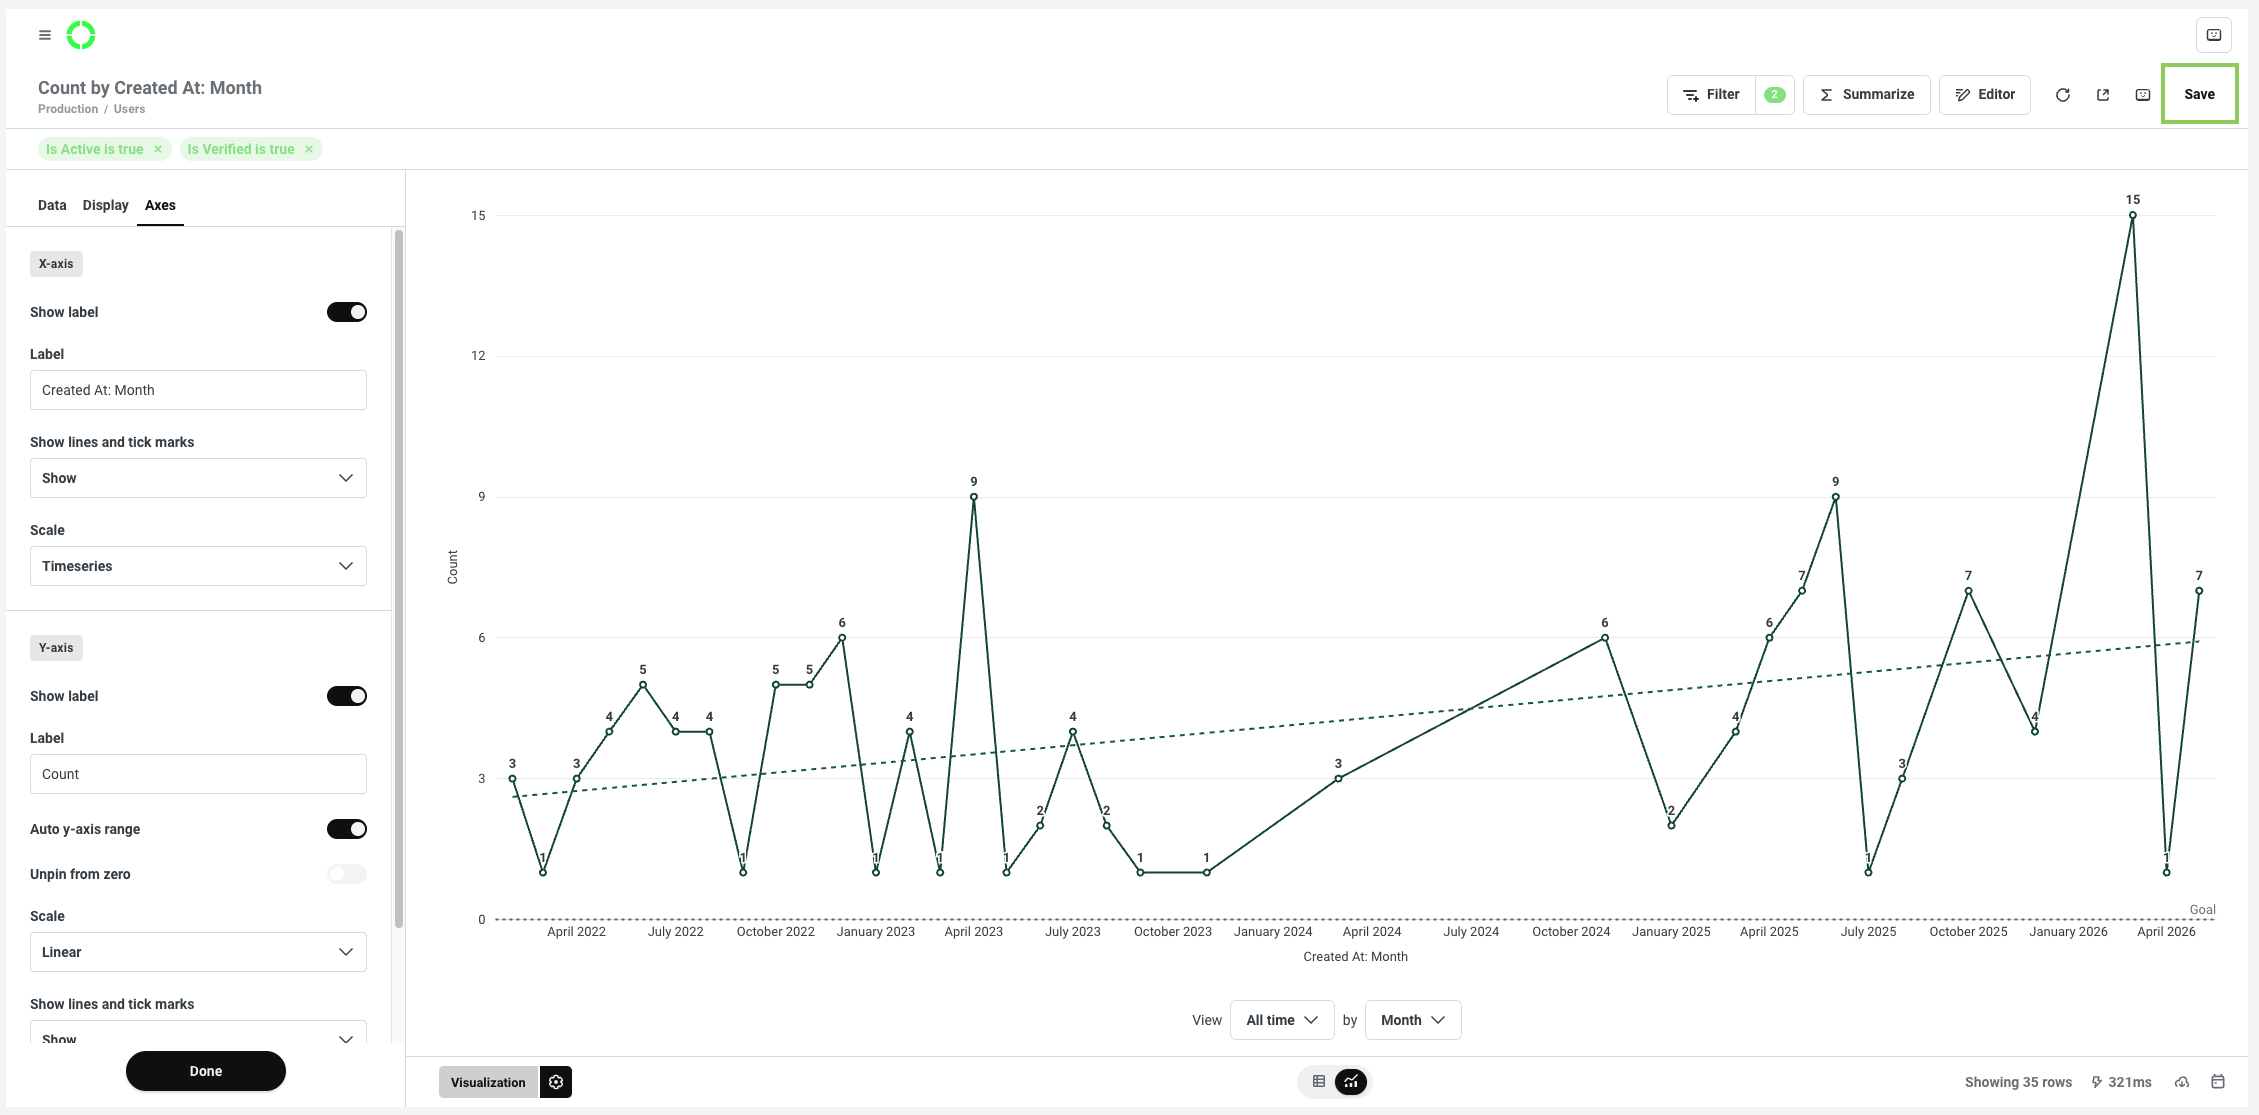
1 - change chart to table2 - select a chart type (Visualization)3 - by clicking the cog ⚙️ you enter the: Data, Display, Axes options
Once done, click Save in the top-right corner.
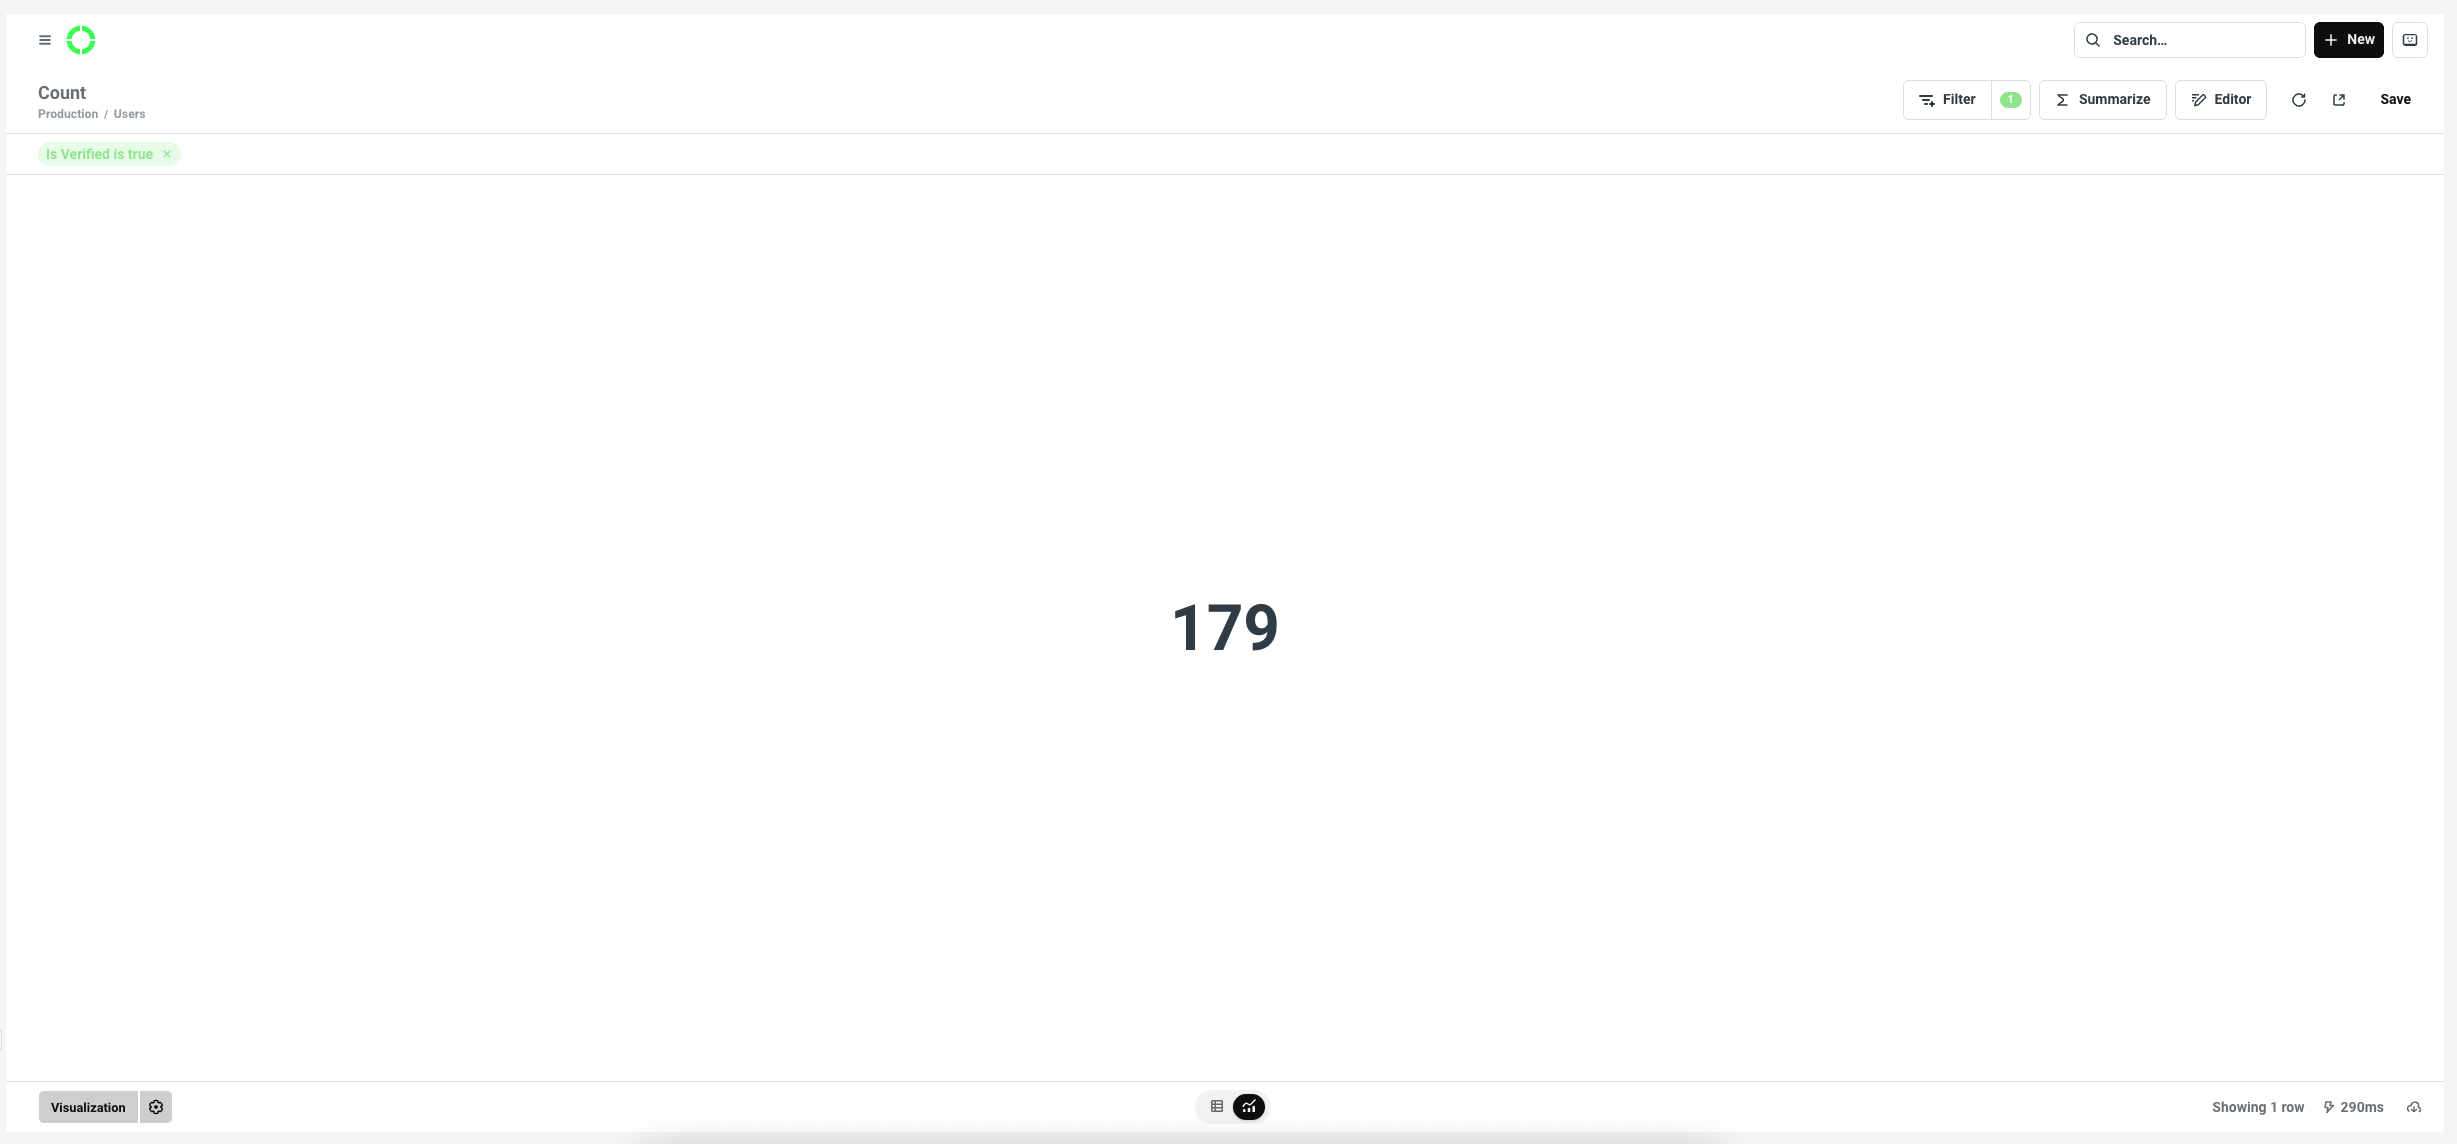
Total number of users:
To create a Questions go to Analytics > Databases > Production > Users
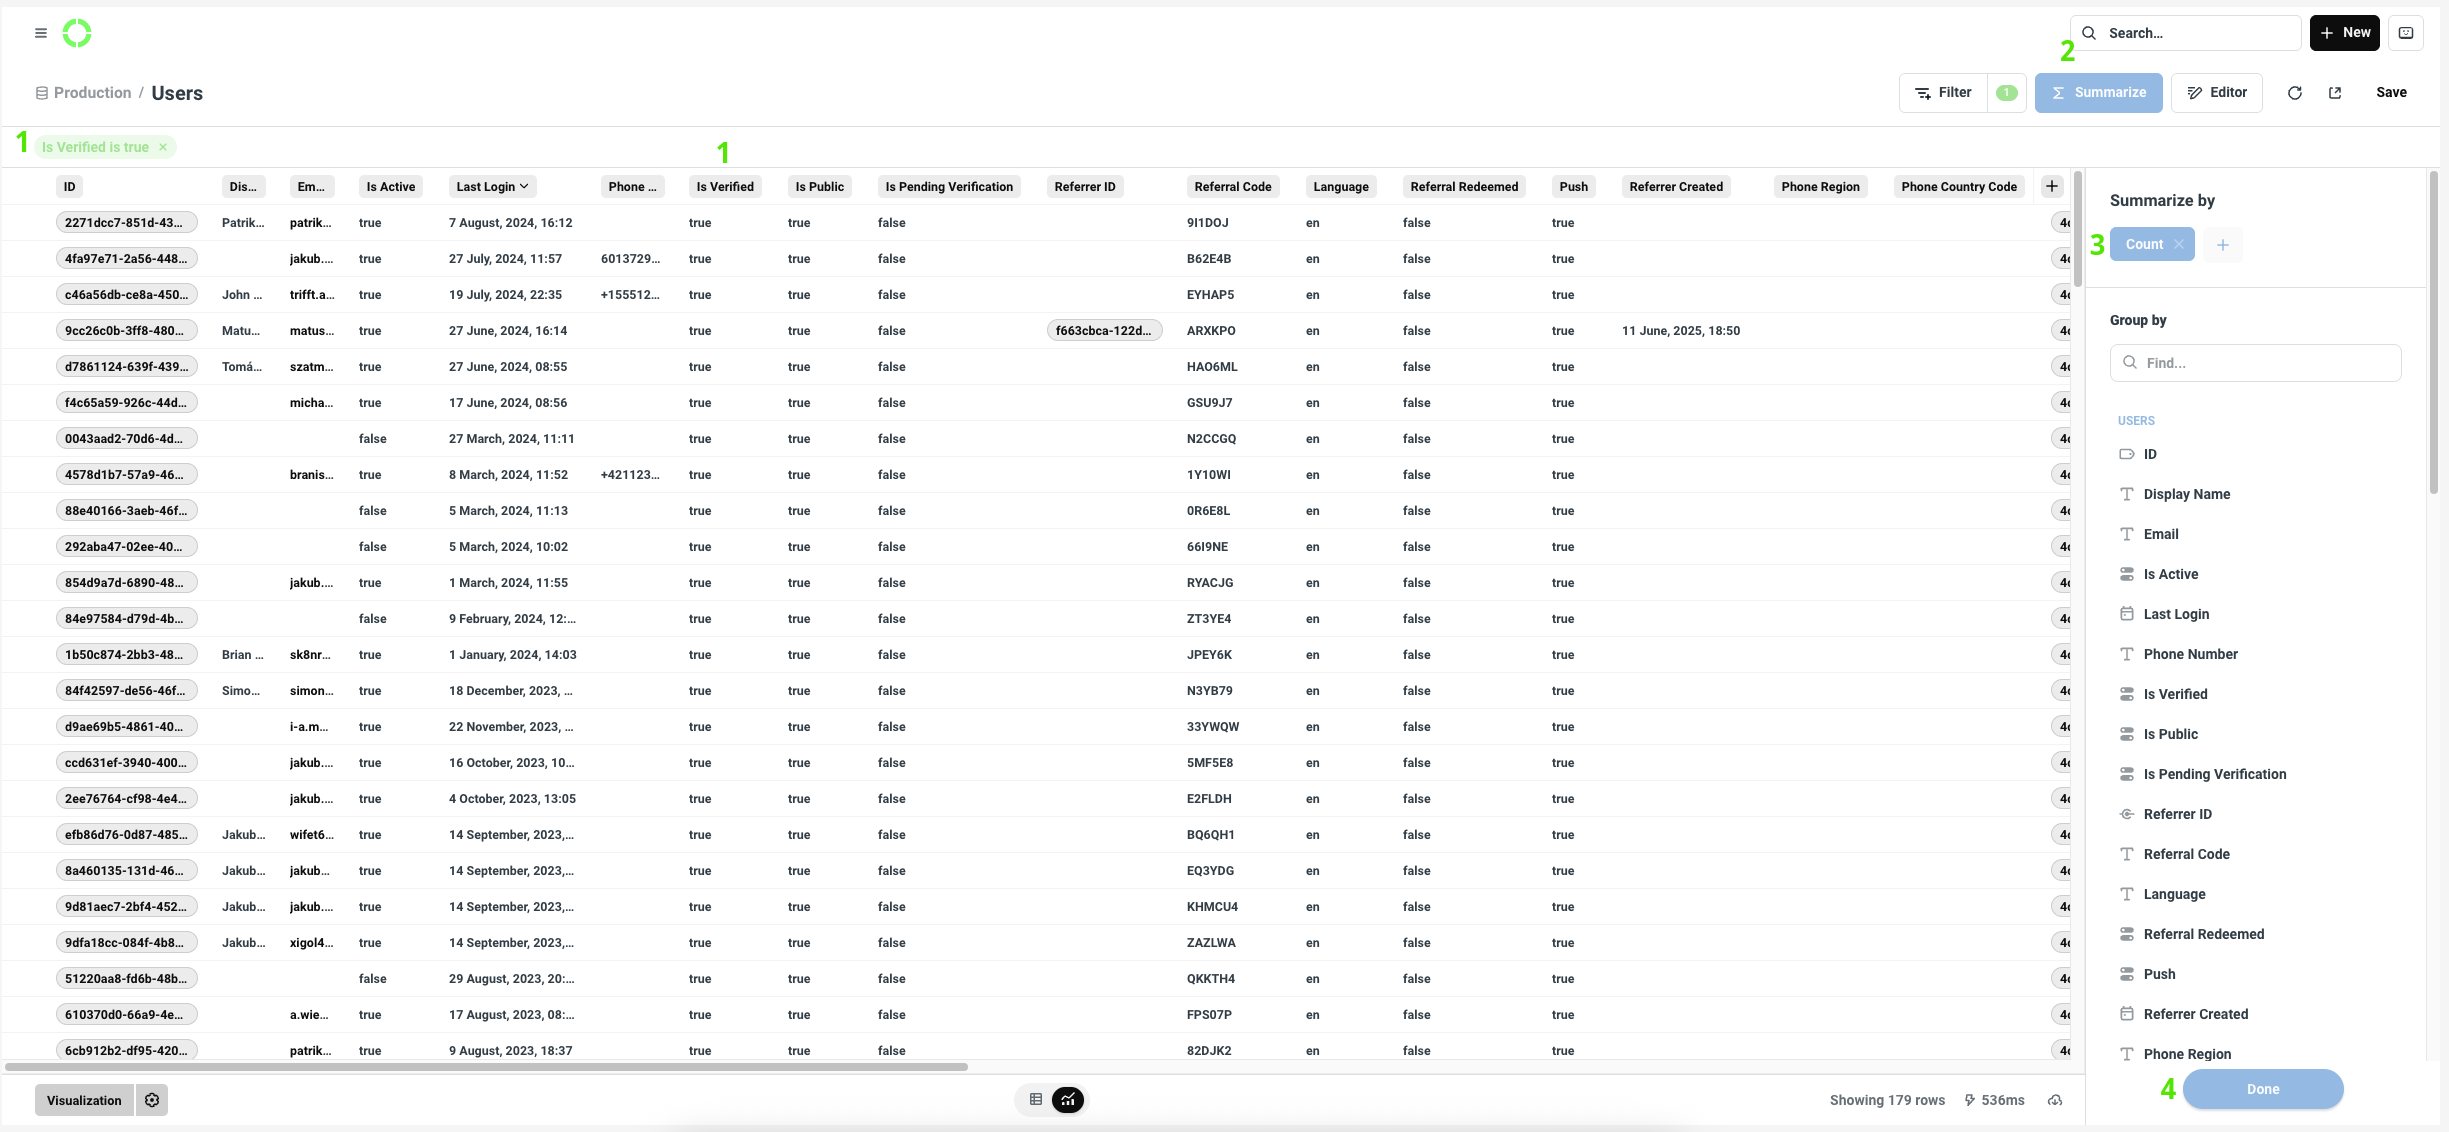
You can apply filter 1 "Is Verified = True" (this will show only verified users)
Click 2 Summarize and choose in Summarize by: 3 "Count", and 4 Done
Average value of transactions (per month):
To create a Questions go to Analytics > Databases > Production > Transactions
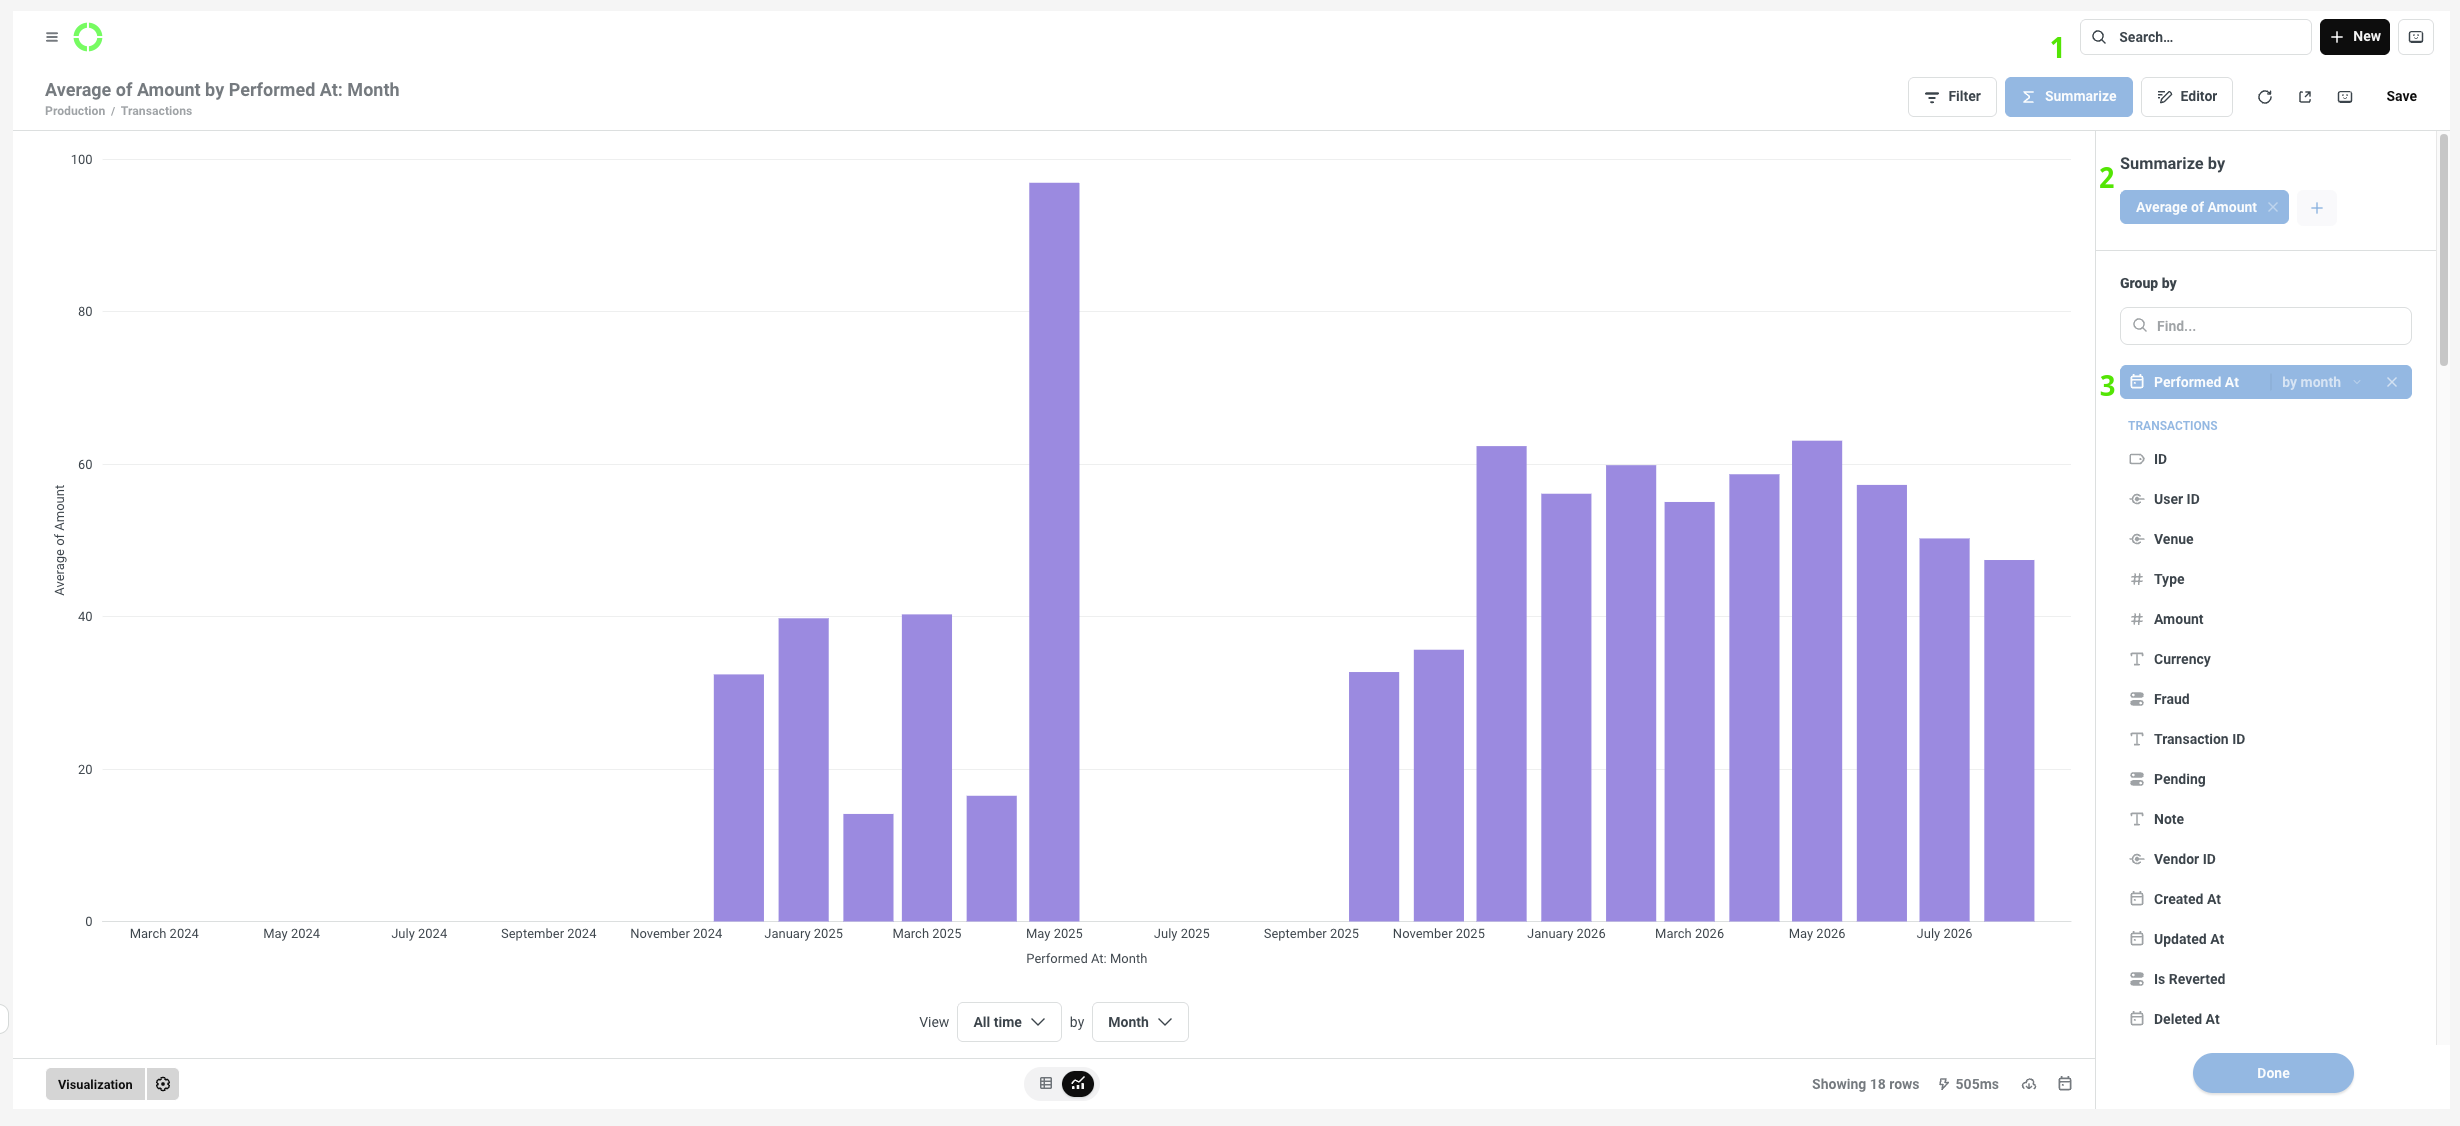
Click 1 Summarize and choose in Summarize by: 2 "Average of Amount", in Group by 3 "Performed At"(here you can choose to group it by: Minute, Hour, Day, Week, Month, Quarter, Year)
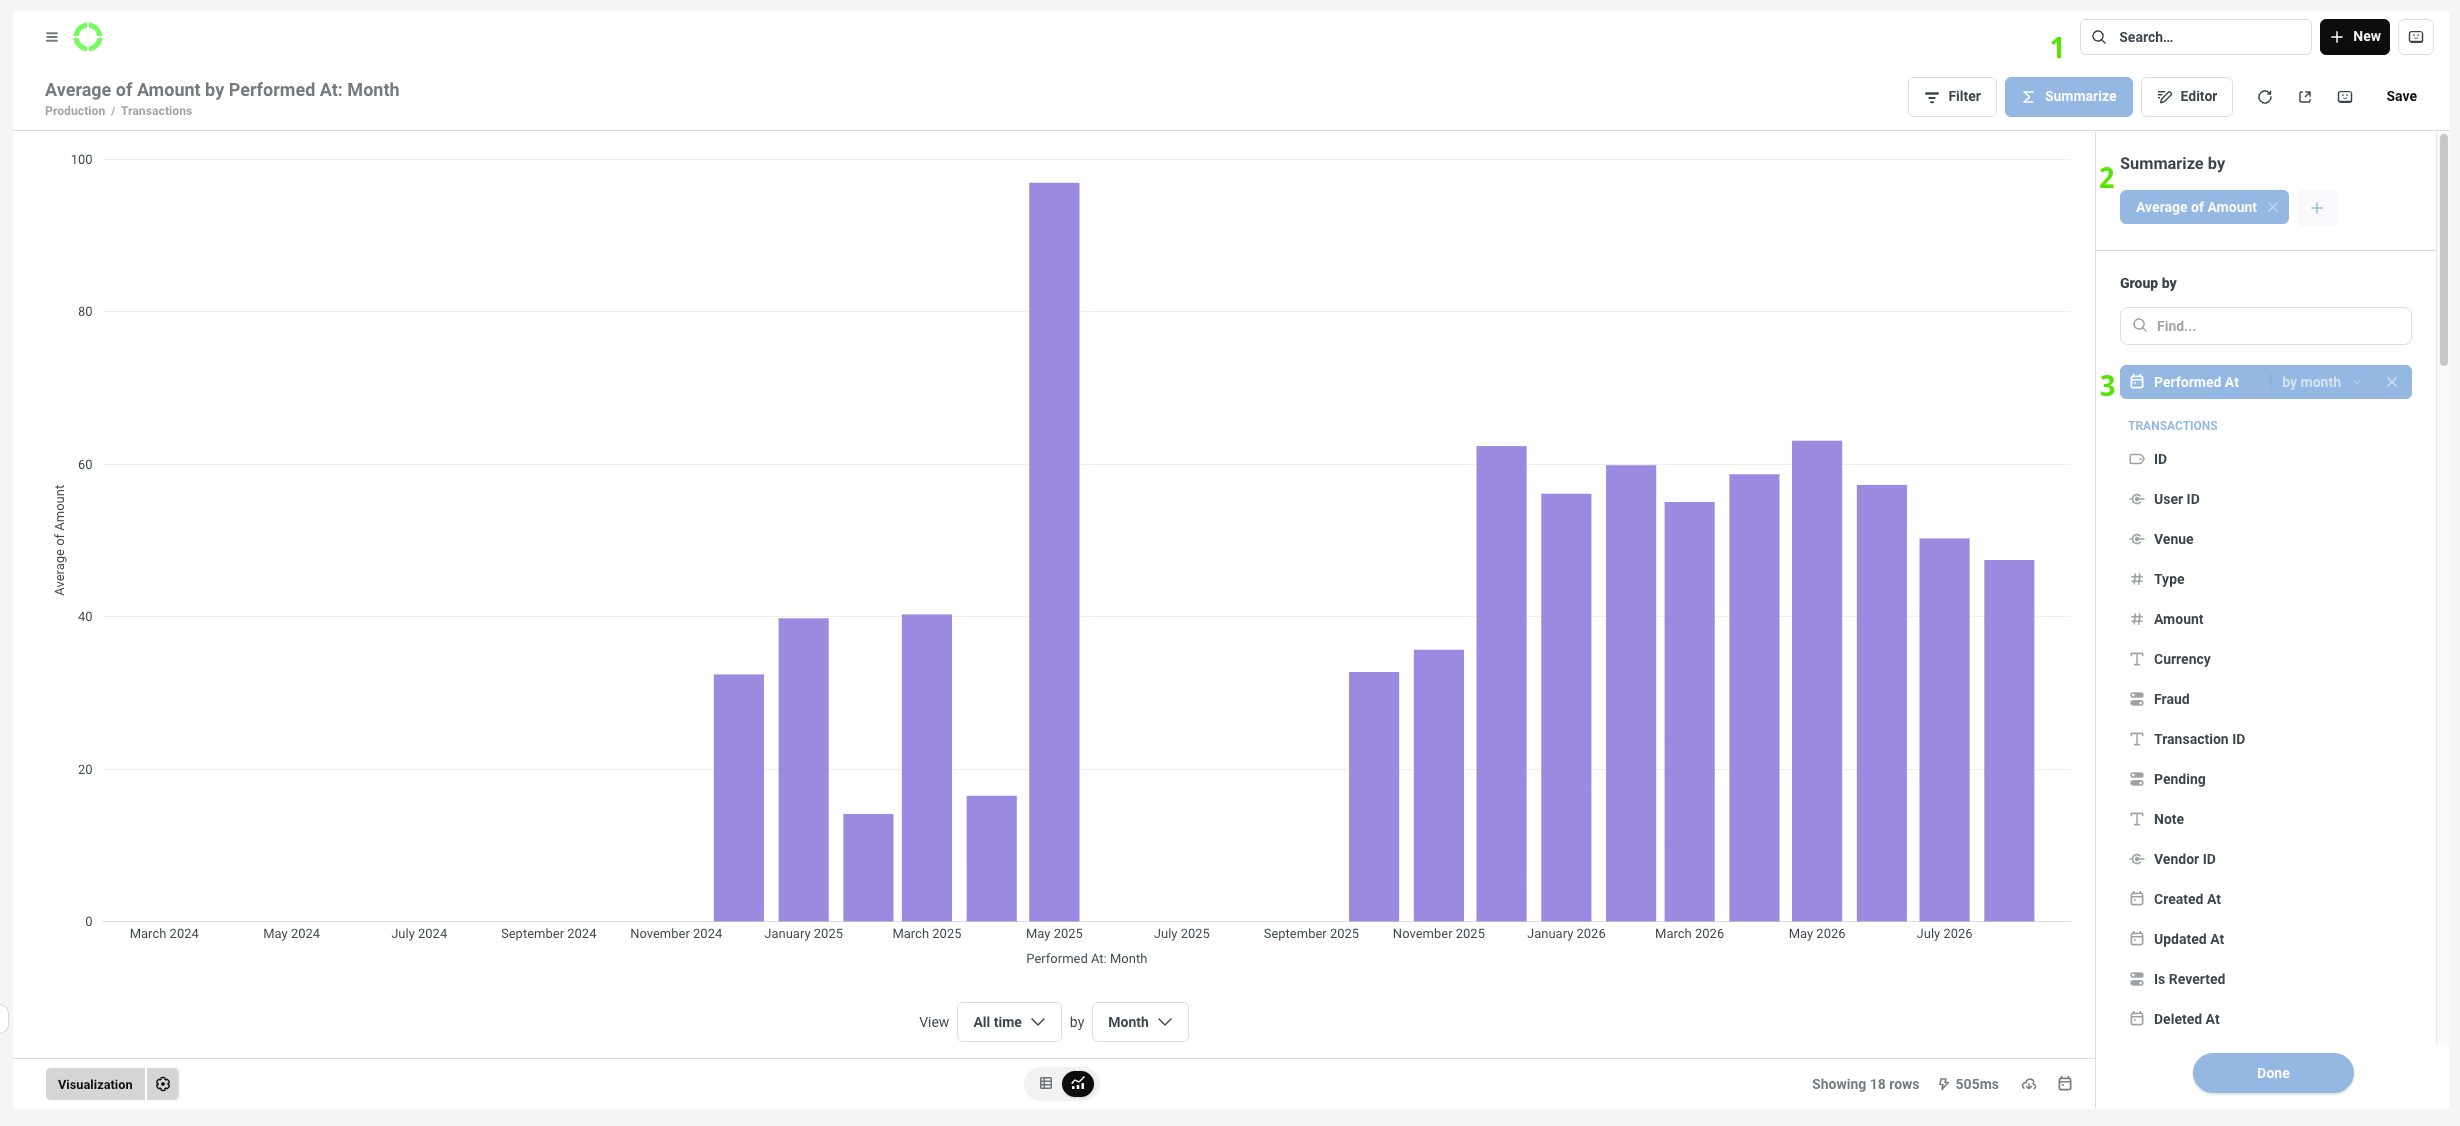
Here you can adjust visual and display settings:
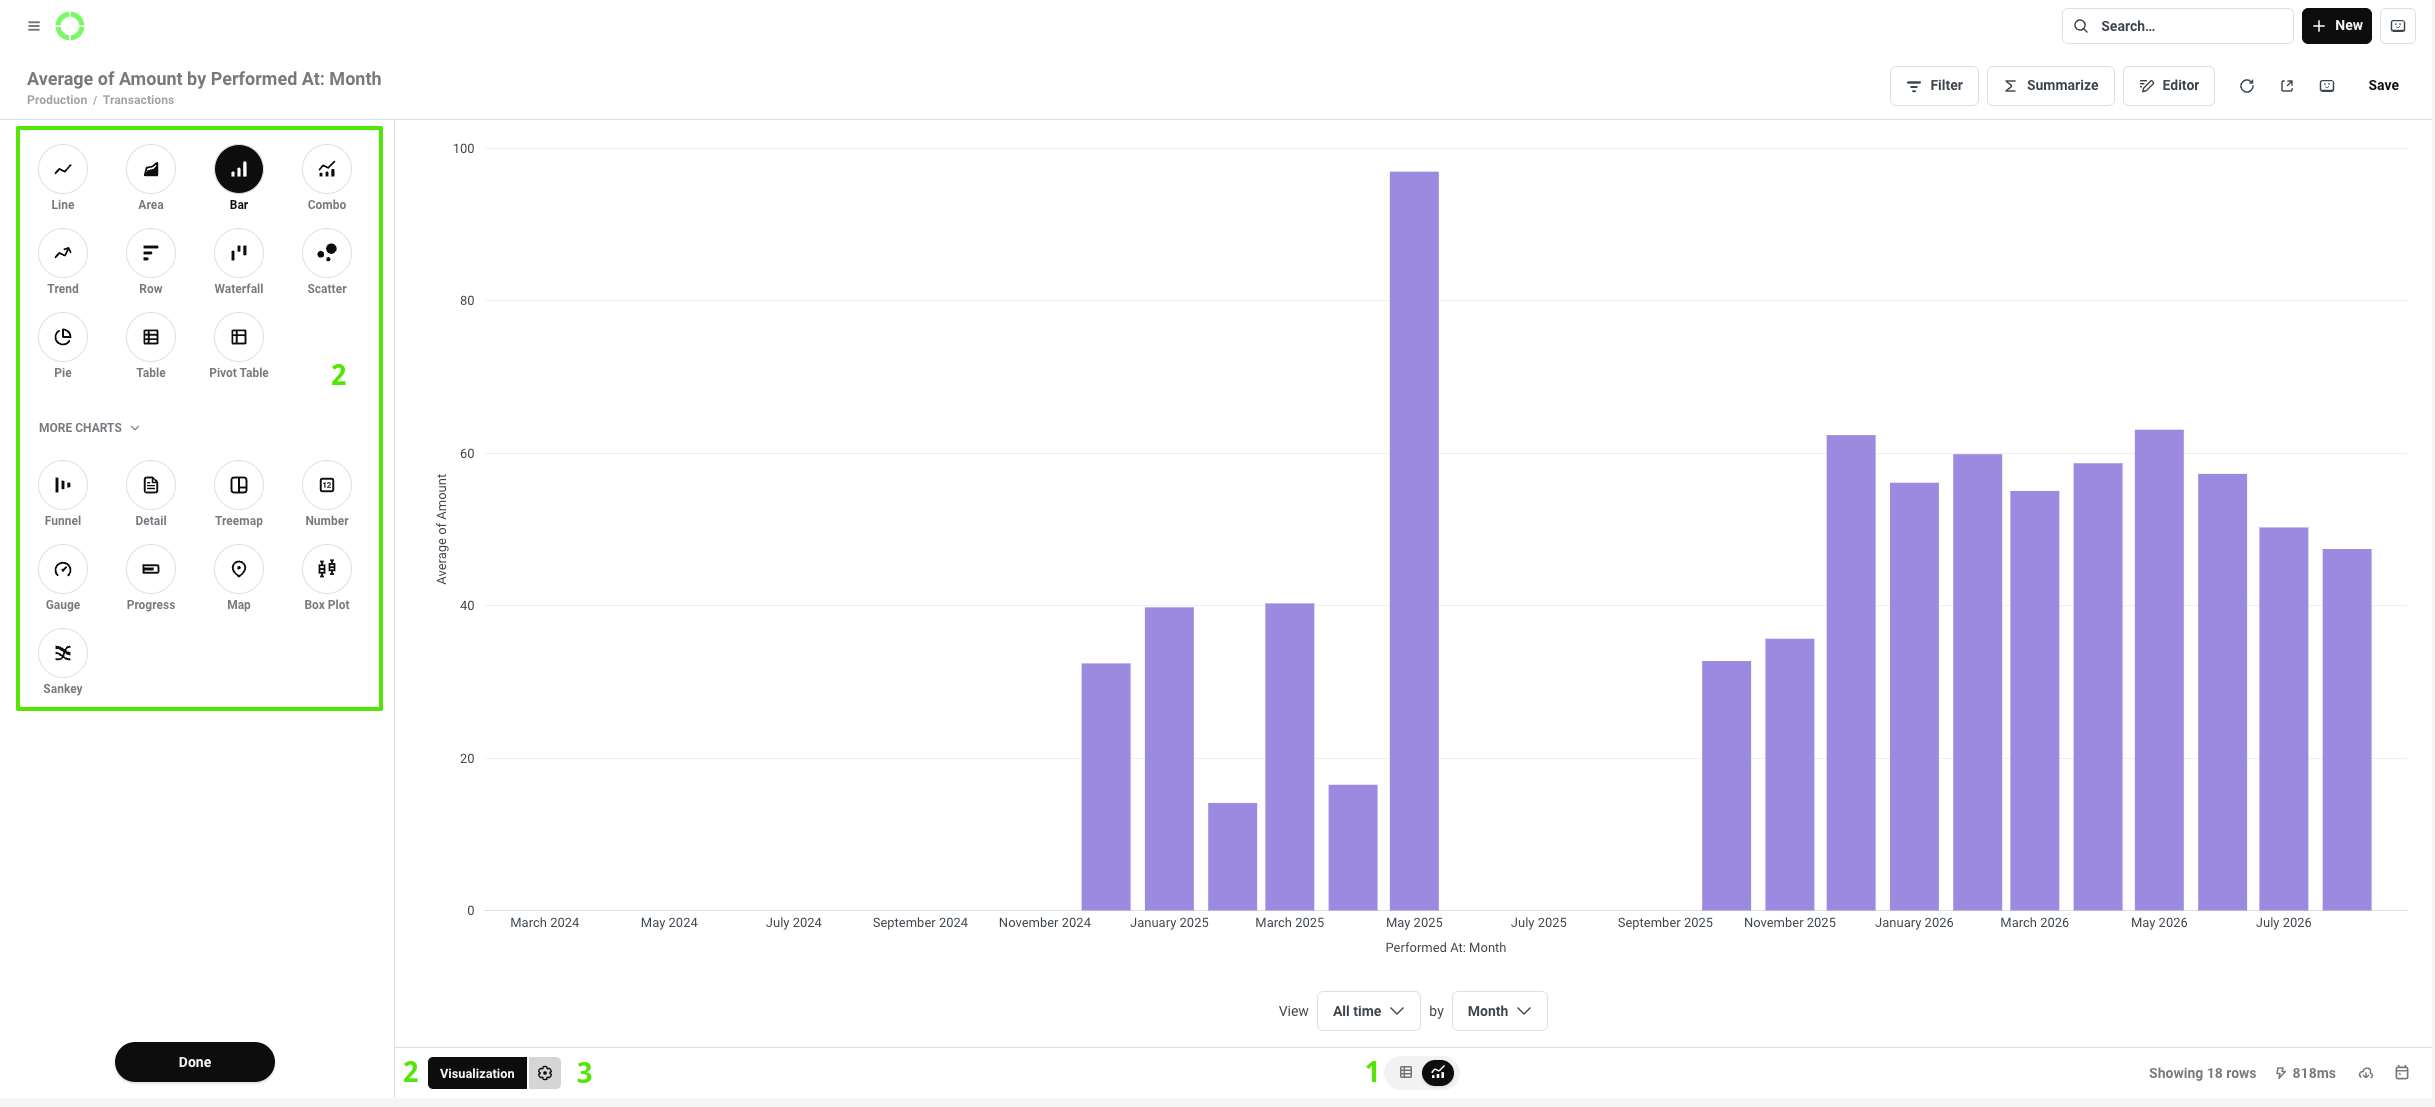
1 - change chart to table2 - select a chart type (Visualization)3 - by clicking the cog ⚙️ you enter the: Data, Display, Axes options
Once done, click Save in the top-right corner.
Number of transactions:
To create a Questions go to Analytics > Databases > Production > Transactions
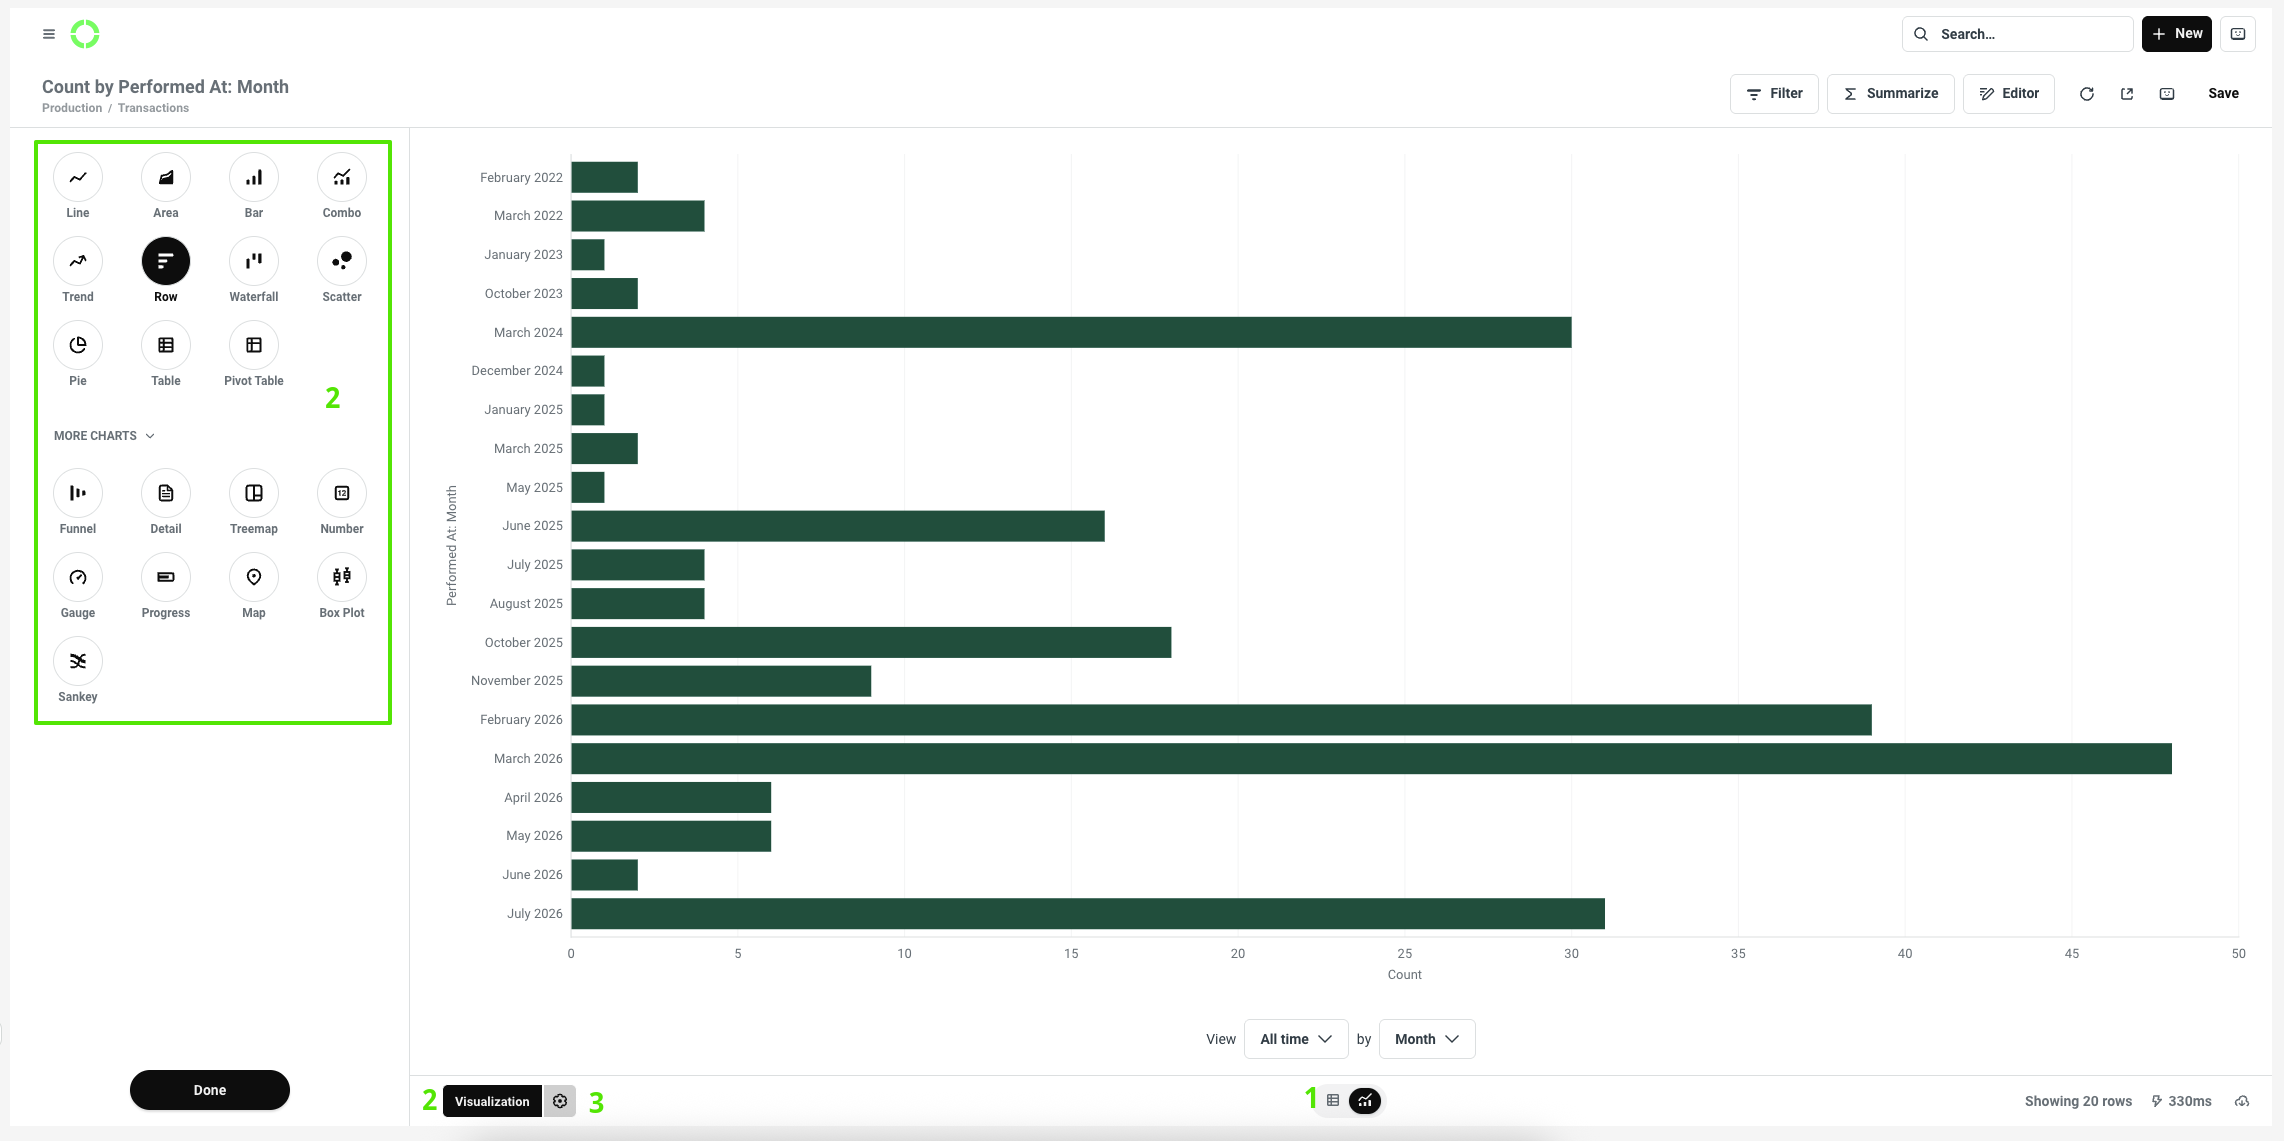
Click 1 Summarize and choose in Summarize by: 2 "Count", in Group by 3 "Performed At"(here you can choose to group it by: Minute, Hour, Day, Week, Month, Quarter, Year)
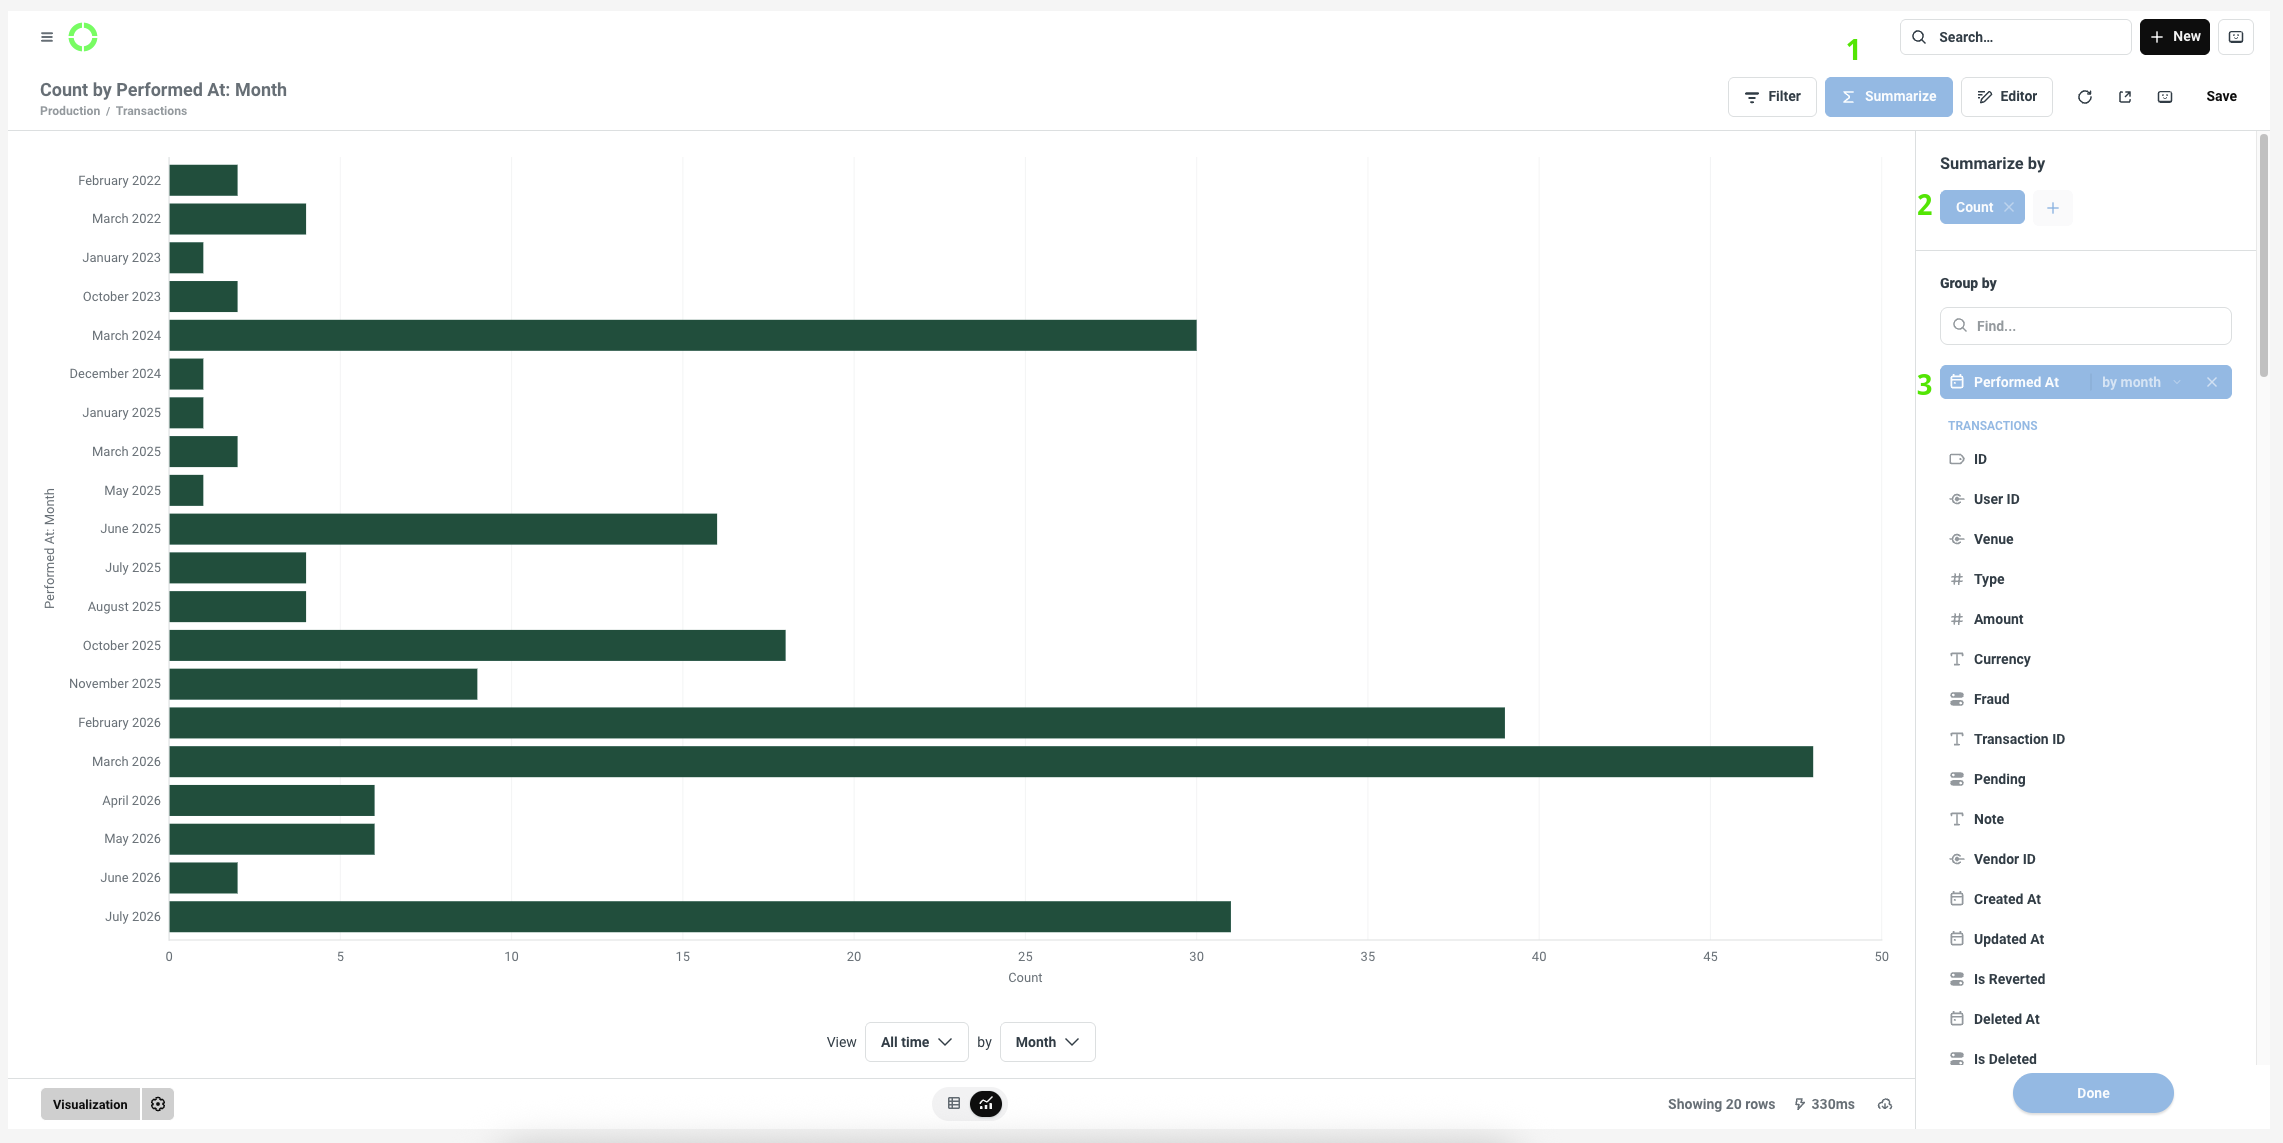
Here you can adjust visual and display settings:
1 - change chart to table2 - select a chart type (Visualization)3 - by clicking the cog ⚙️ you enter the: Data, Display, Axes options
Once done, click Save in the top-right corner.
Transactions by locations:
To create a Questions go to Analytics > Databases > Production > Transactions
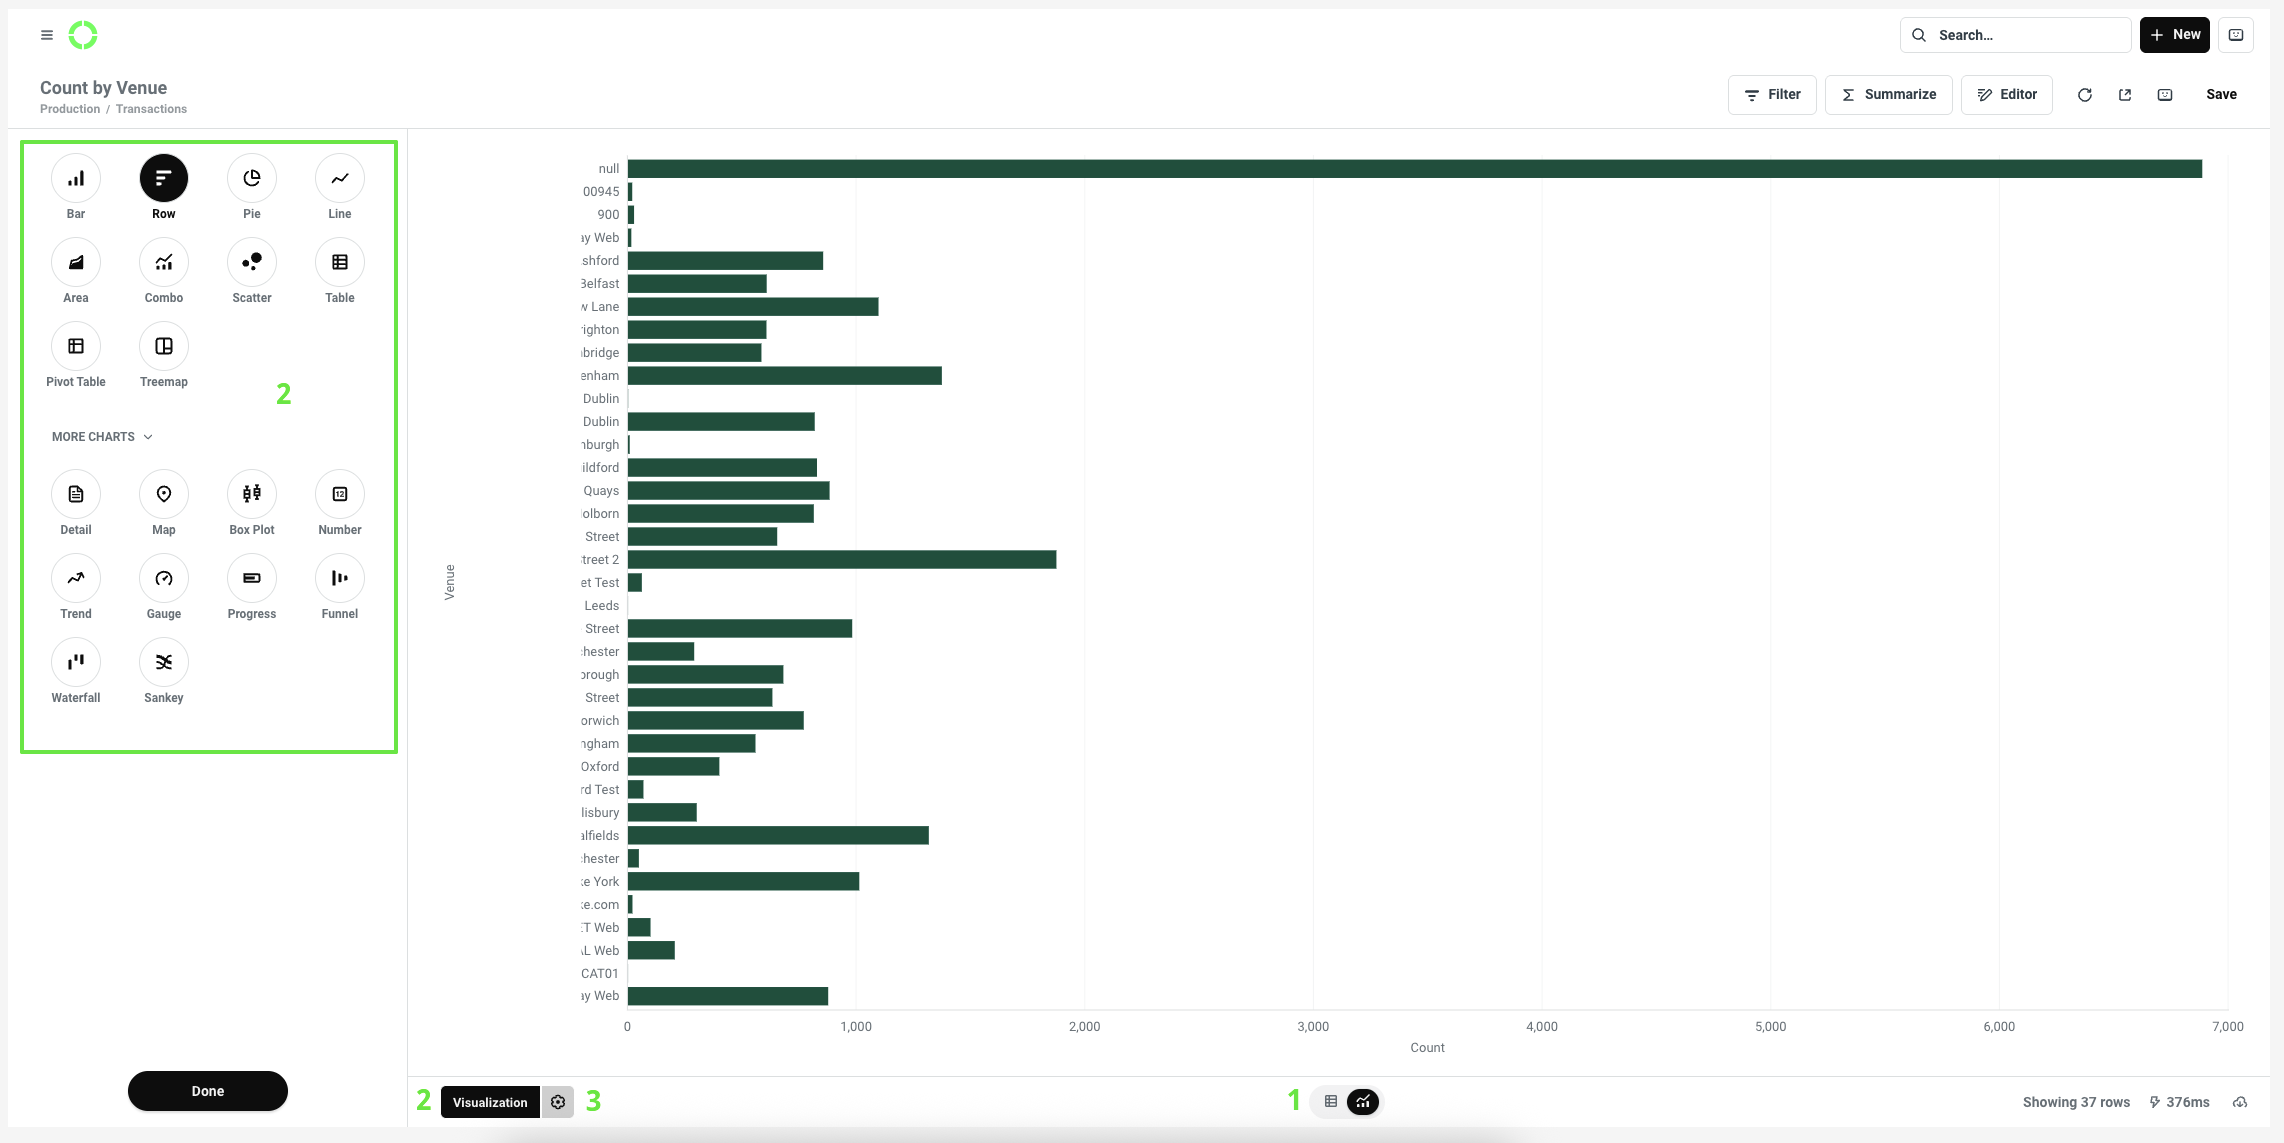
Click 1 Summarize and choose in Summarize by: 2 "Count", in Group by: 3 "Venue"
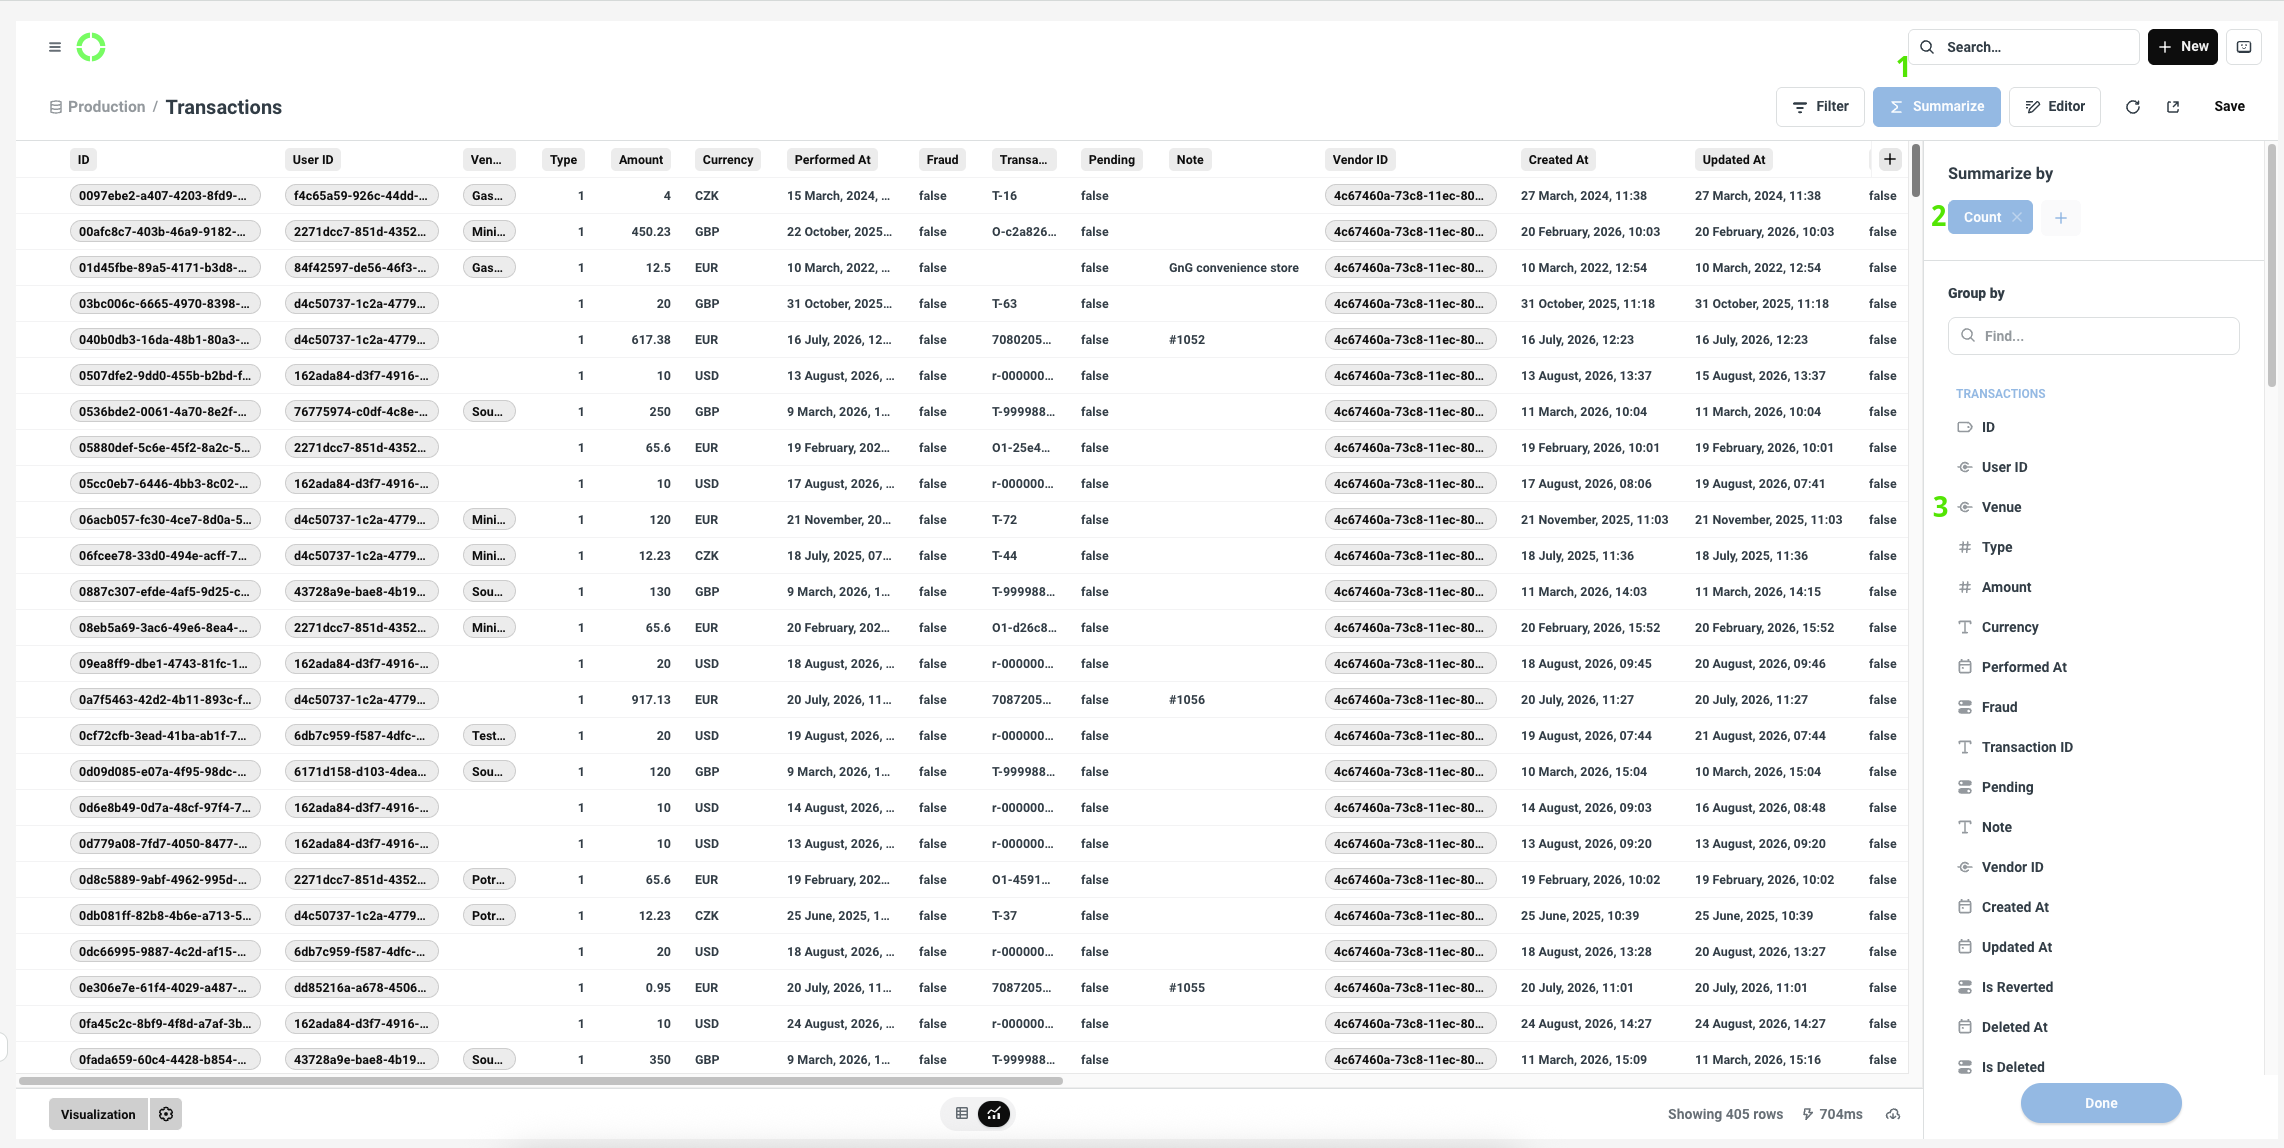
Here you can adjust visual and display settings:
1 - change chart to table2 - select a chart type (Visualization)3 - by clicking the cog ⚙️ you enter the: Data, Display, Axes options
Once done, click Save in the top-right corner.
Frequency by number of purchases:
To create a Questions go to Analytics > Databases > Production > Transactions
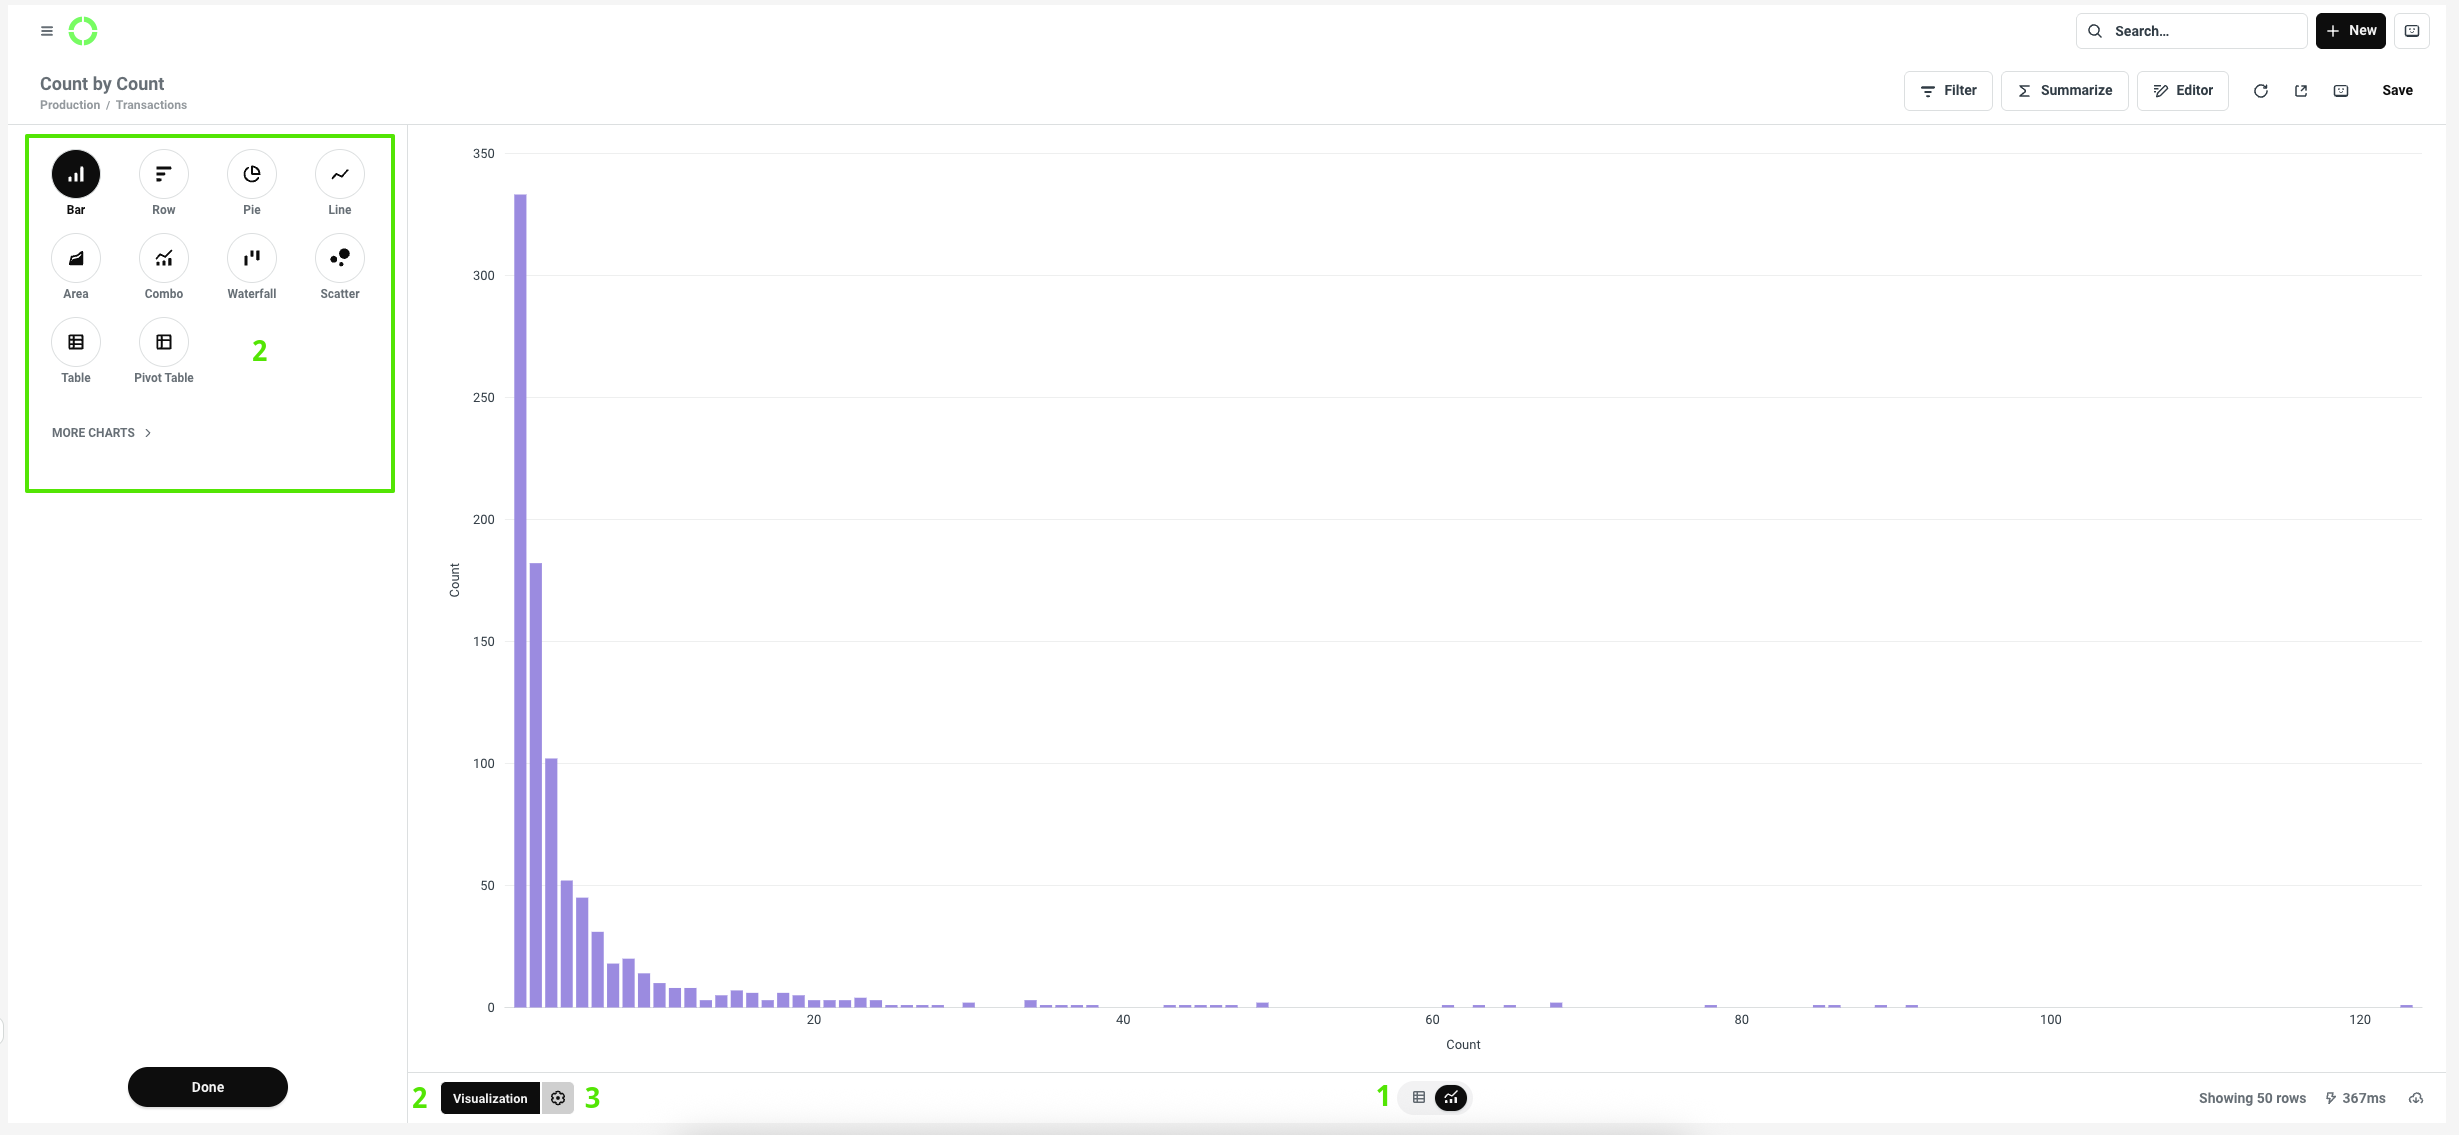
Click 1 Summarize and choose in Summarize by: 2 "Count", in Group by 3 "Count"
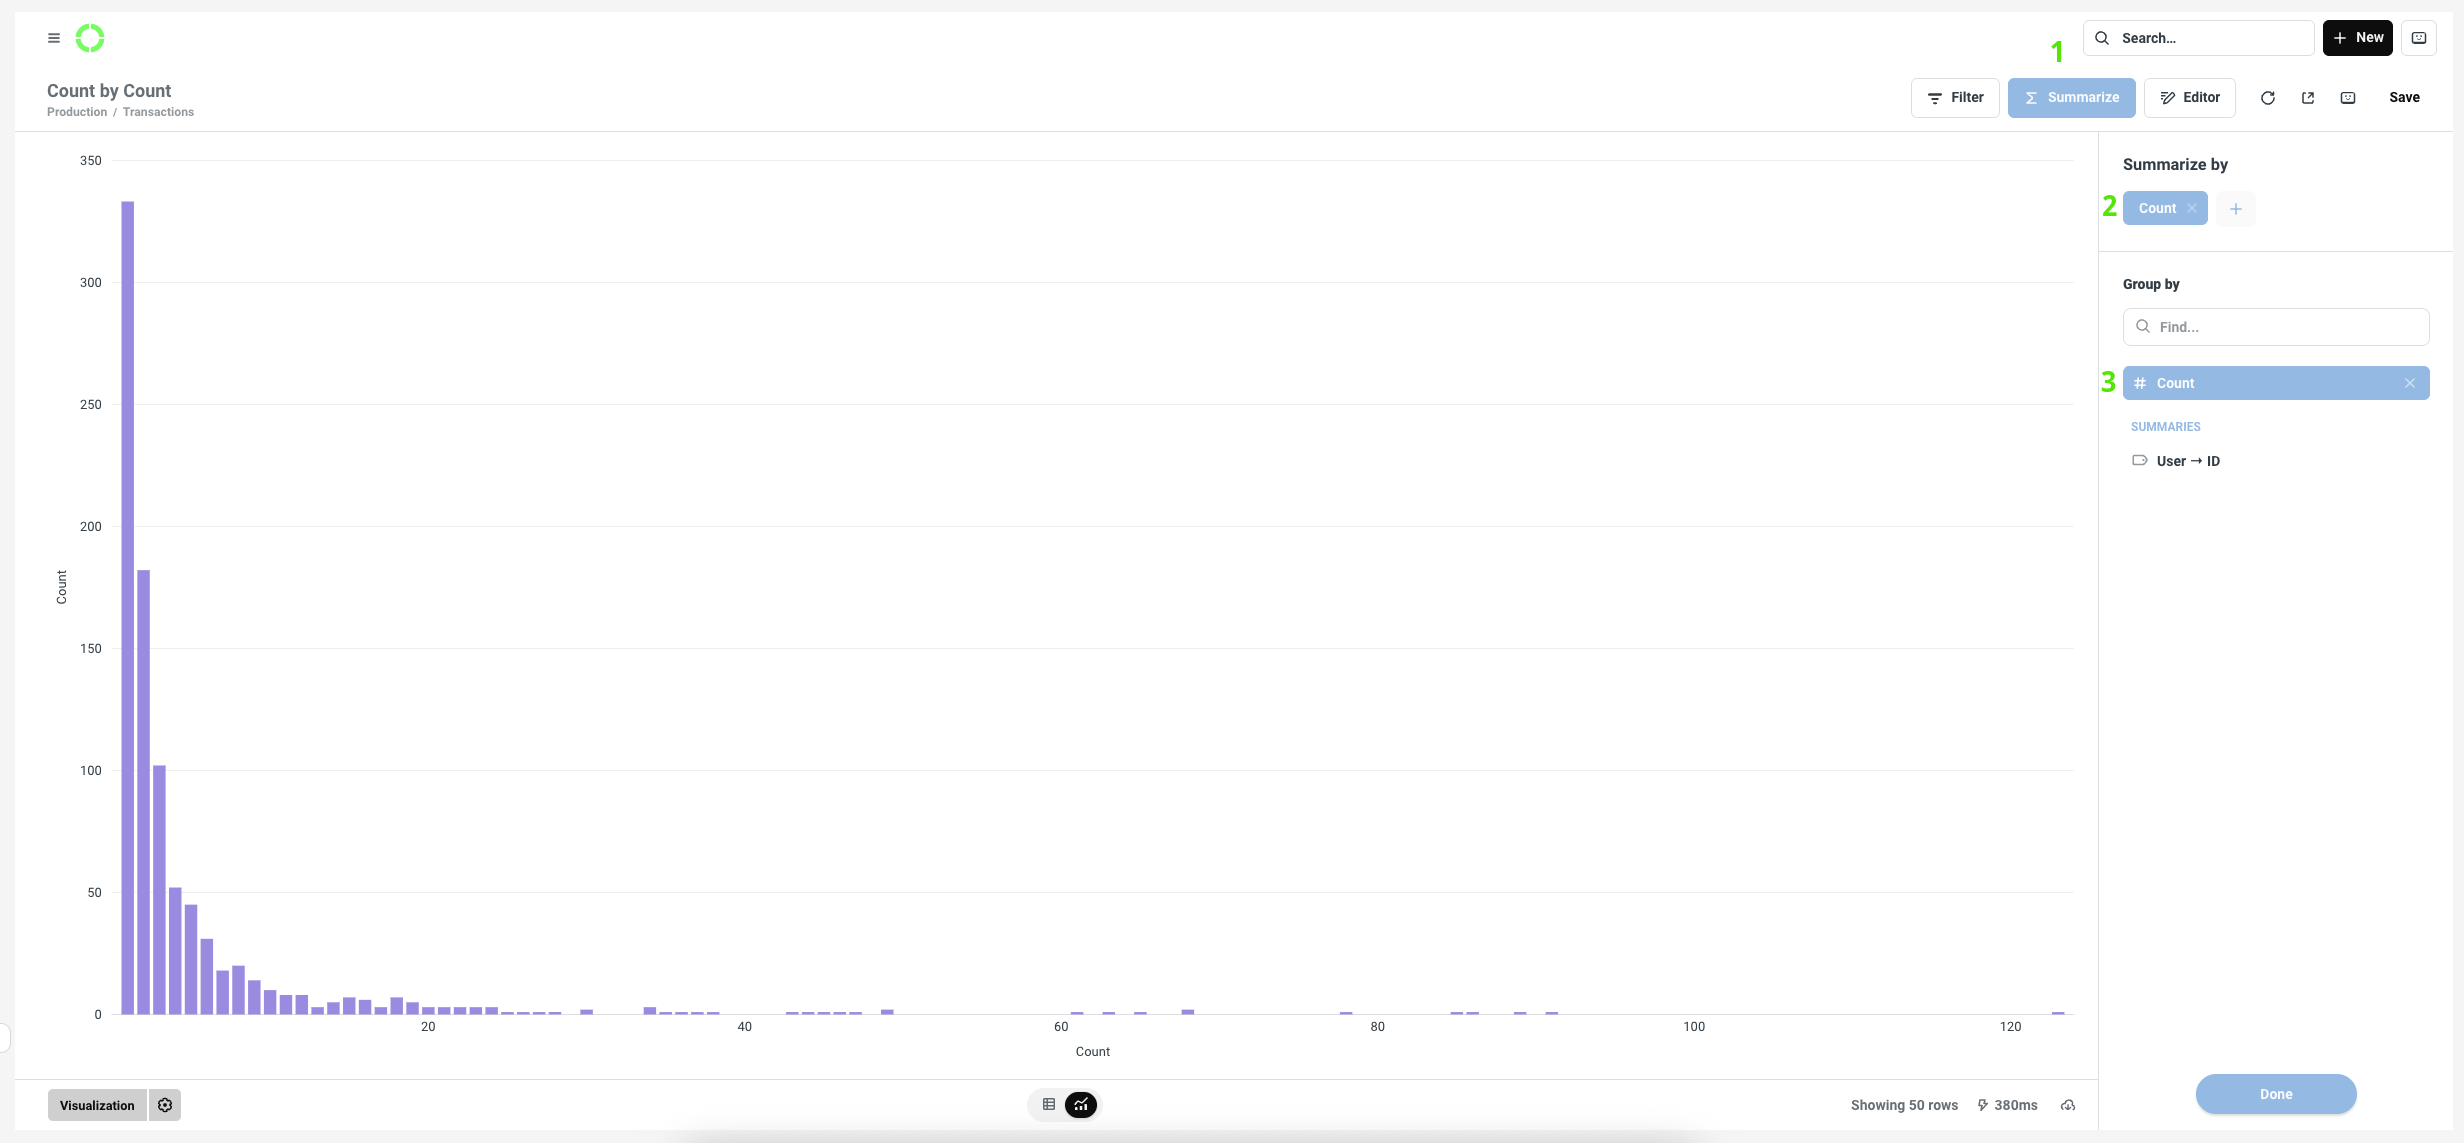
The EDITOR preview will look like this:
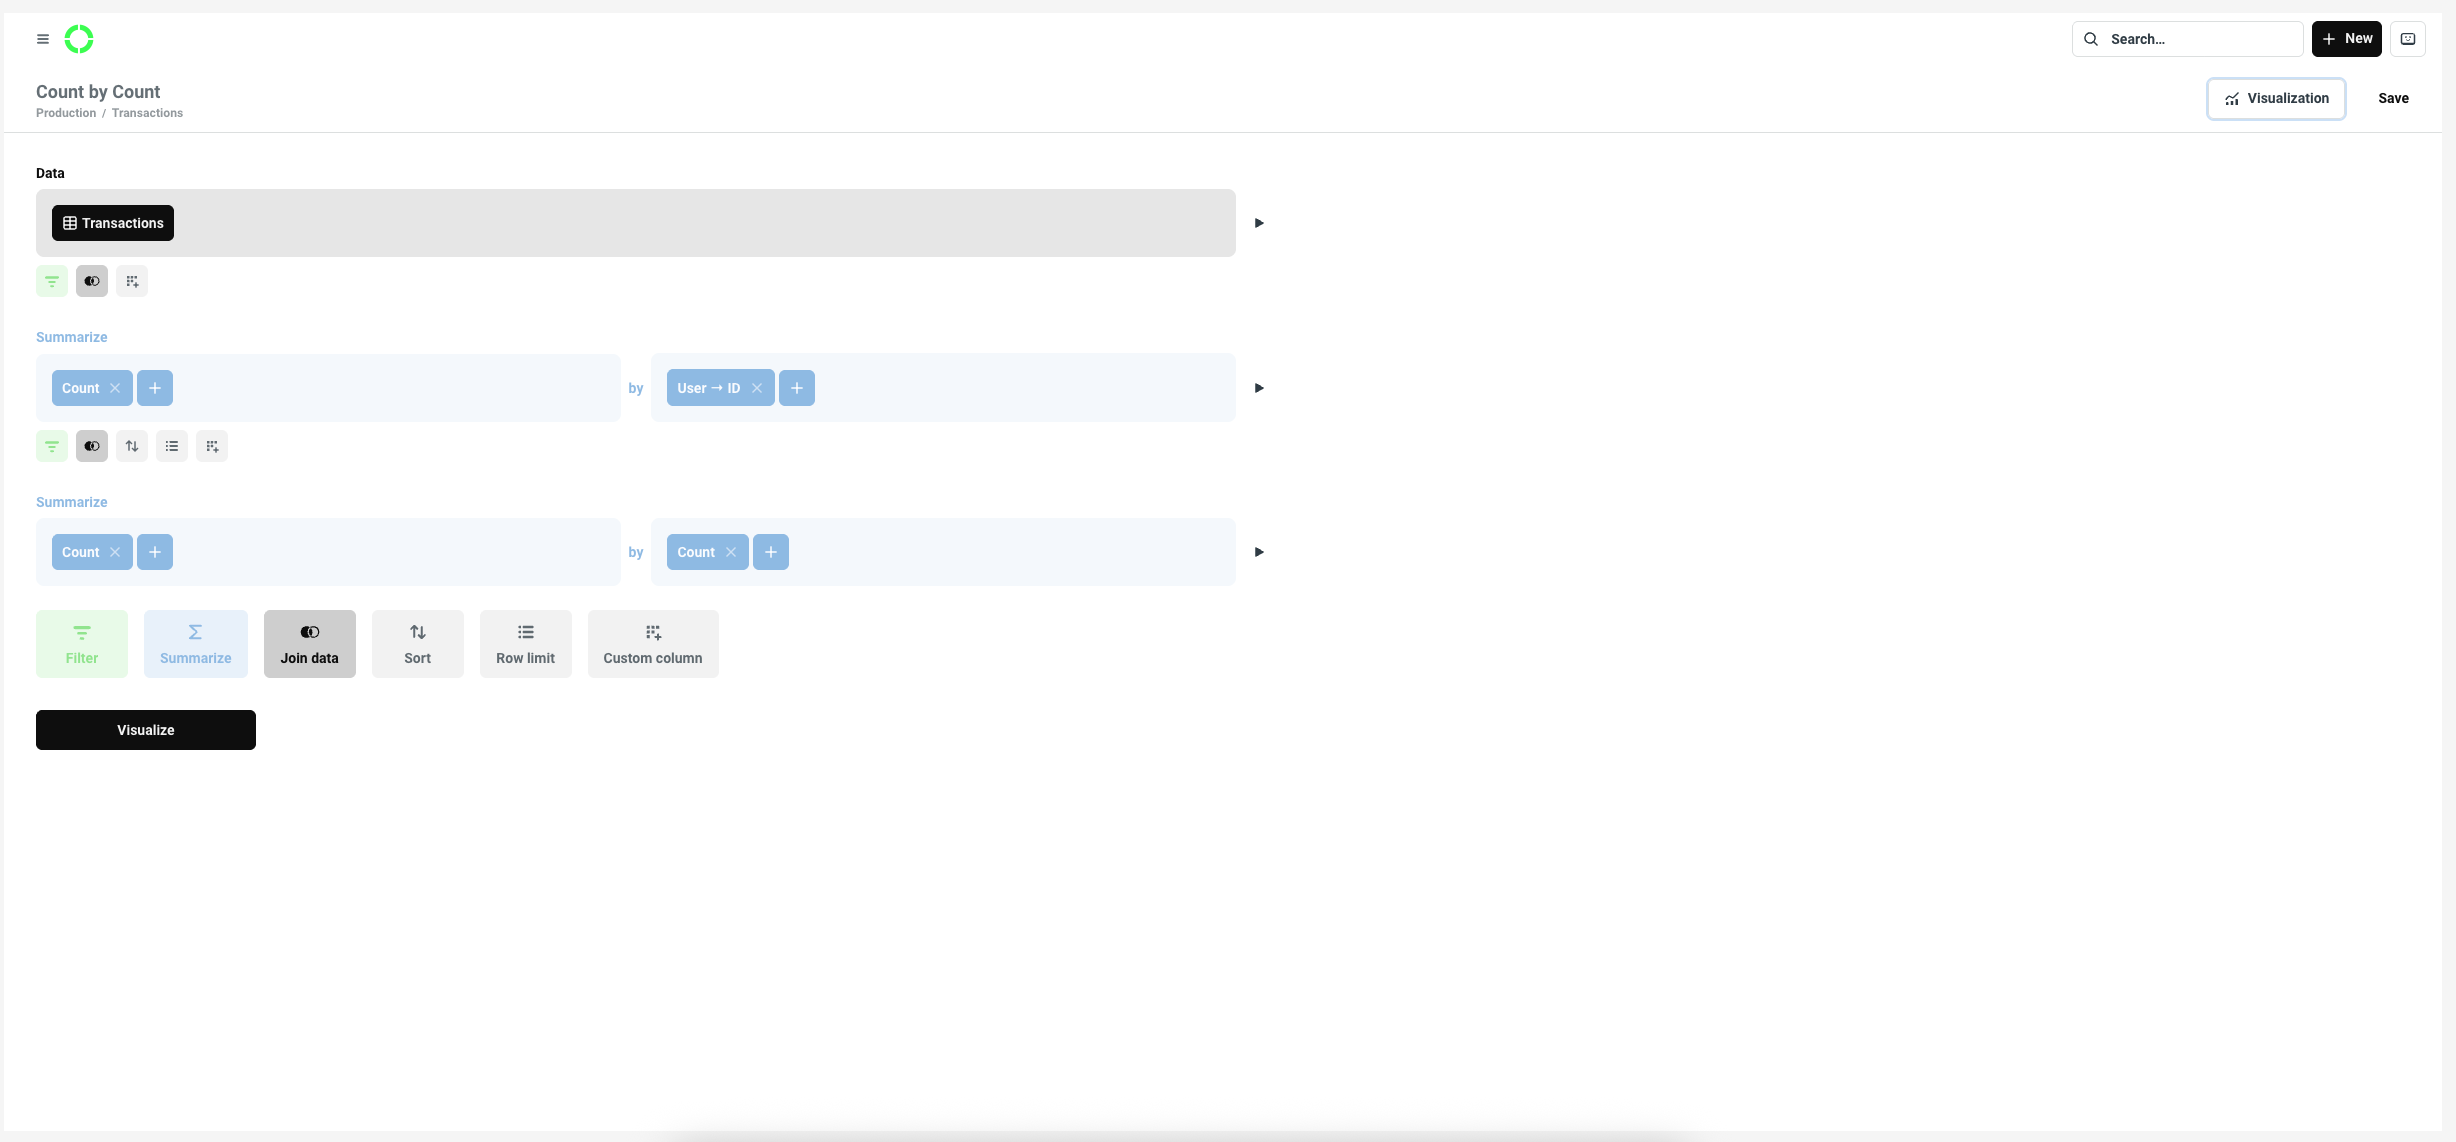
Here you can adjust visual and display settings:
1 - change chart to table2 - select a chart type (Visualization)3 - by clicking the cog ⚙️ you enter the: Data, Display, Axes options
Once done, click Save in the top-right corner.
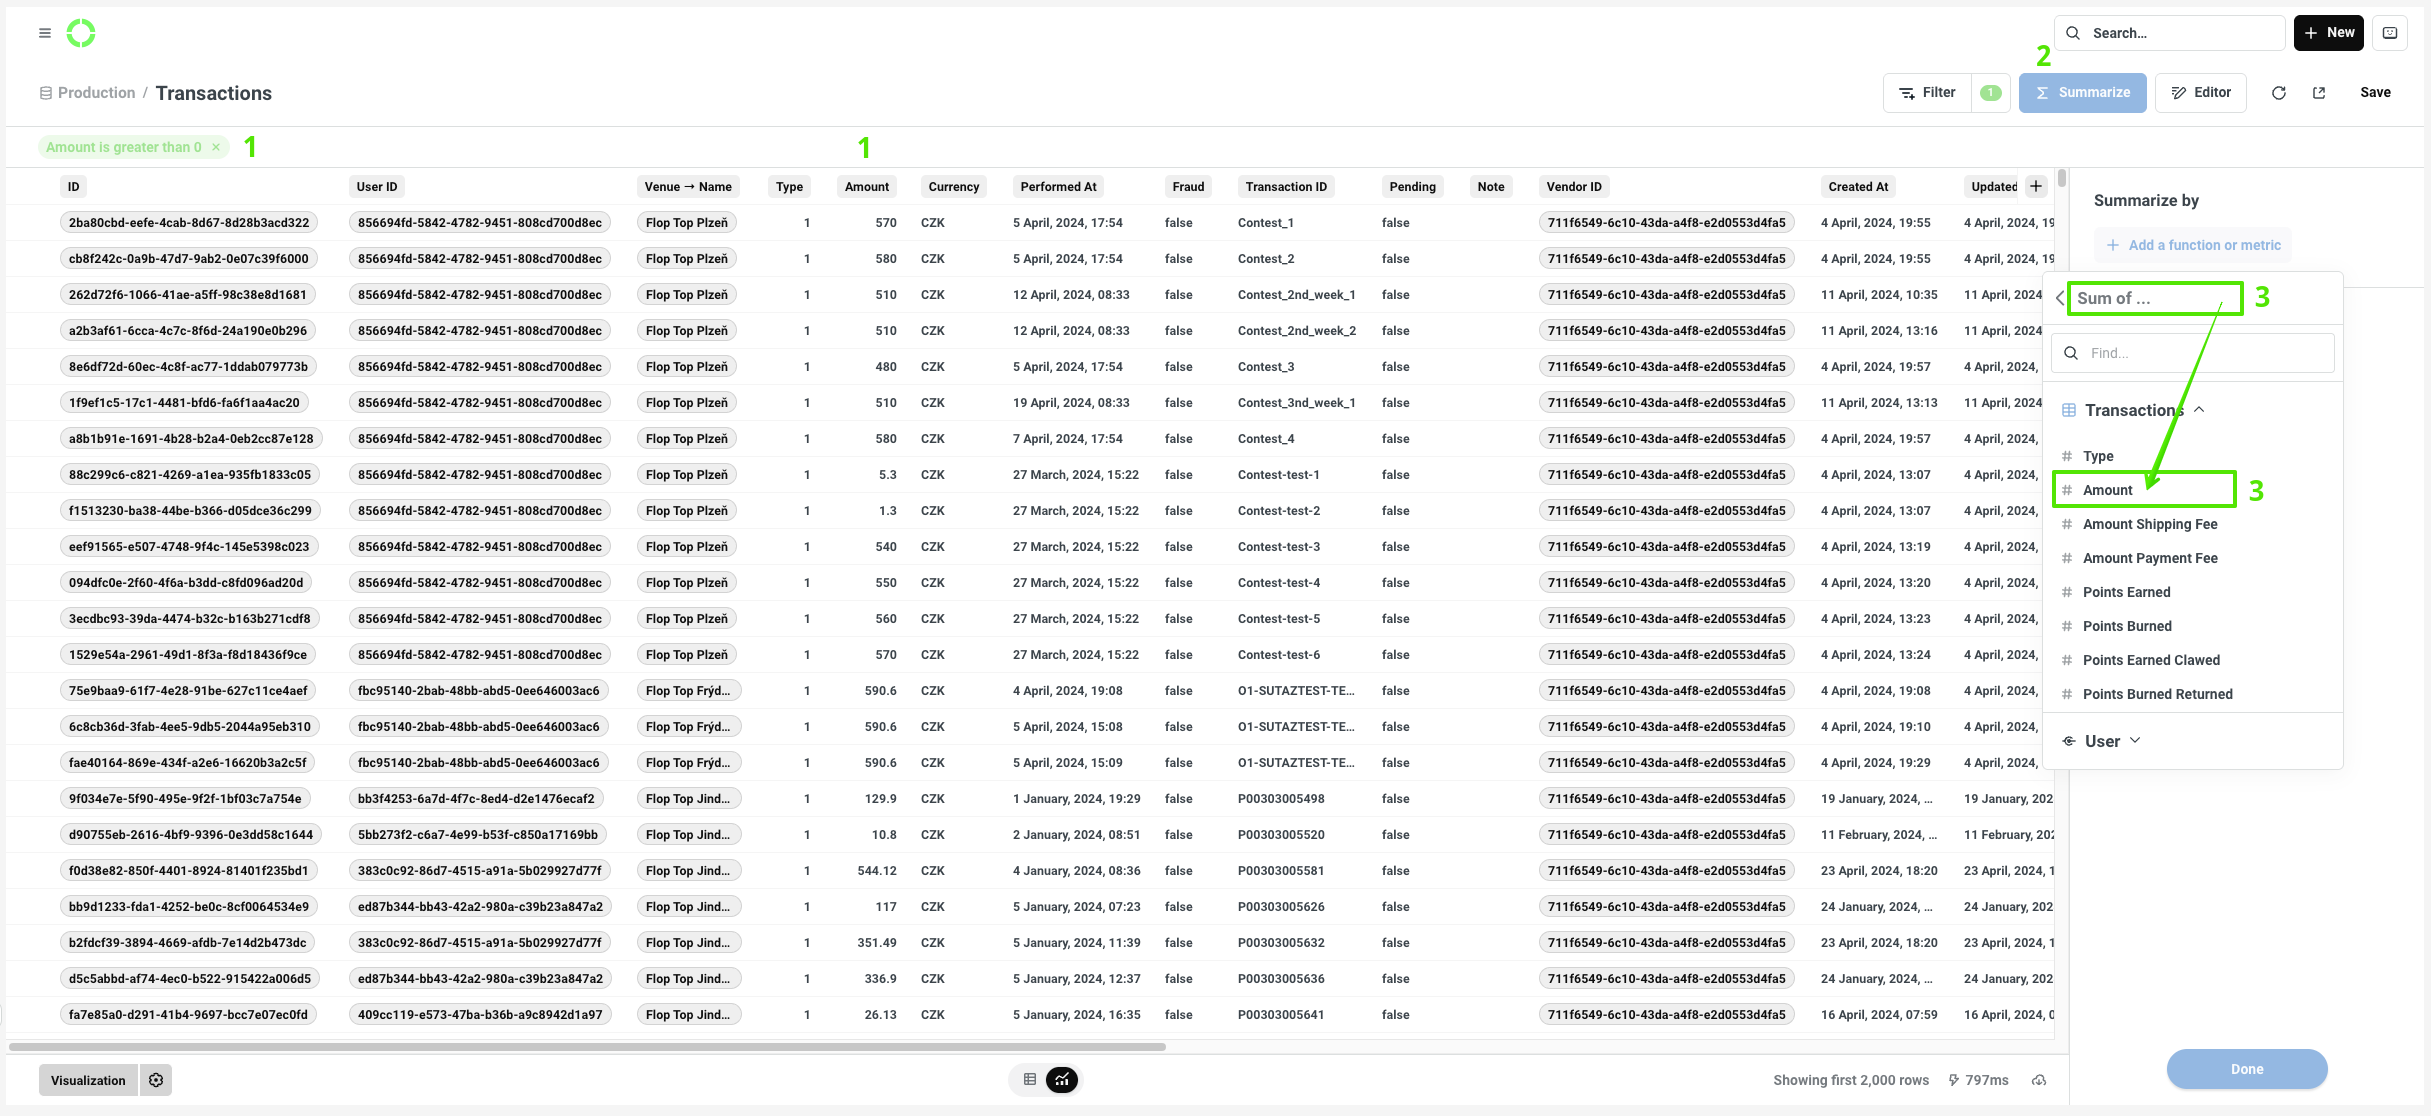
Total Value of Transactions where Amount is greater than 0:
To create a Questions go to Analytics > Databases > Production > Transactions
Use filter: 1 "Amount = Is greater than 0" Click 2 Summarize and choose in Summarize by: 3 "Sum of Amount"
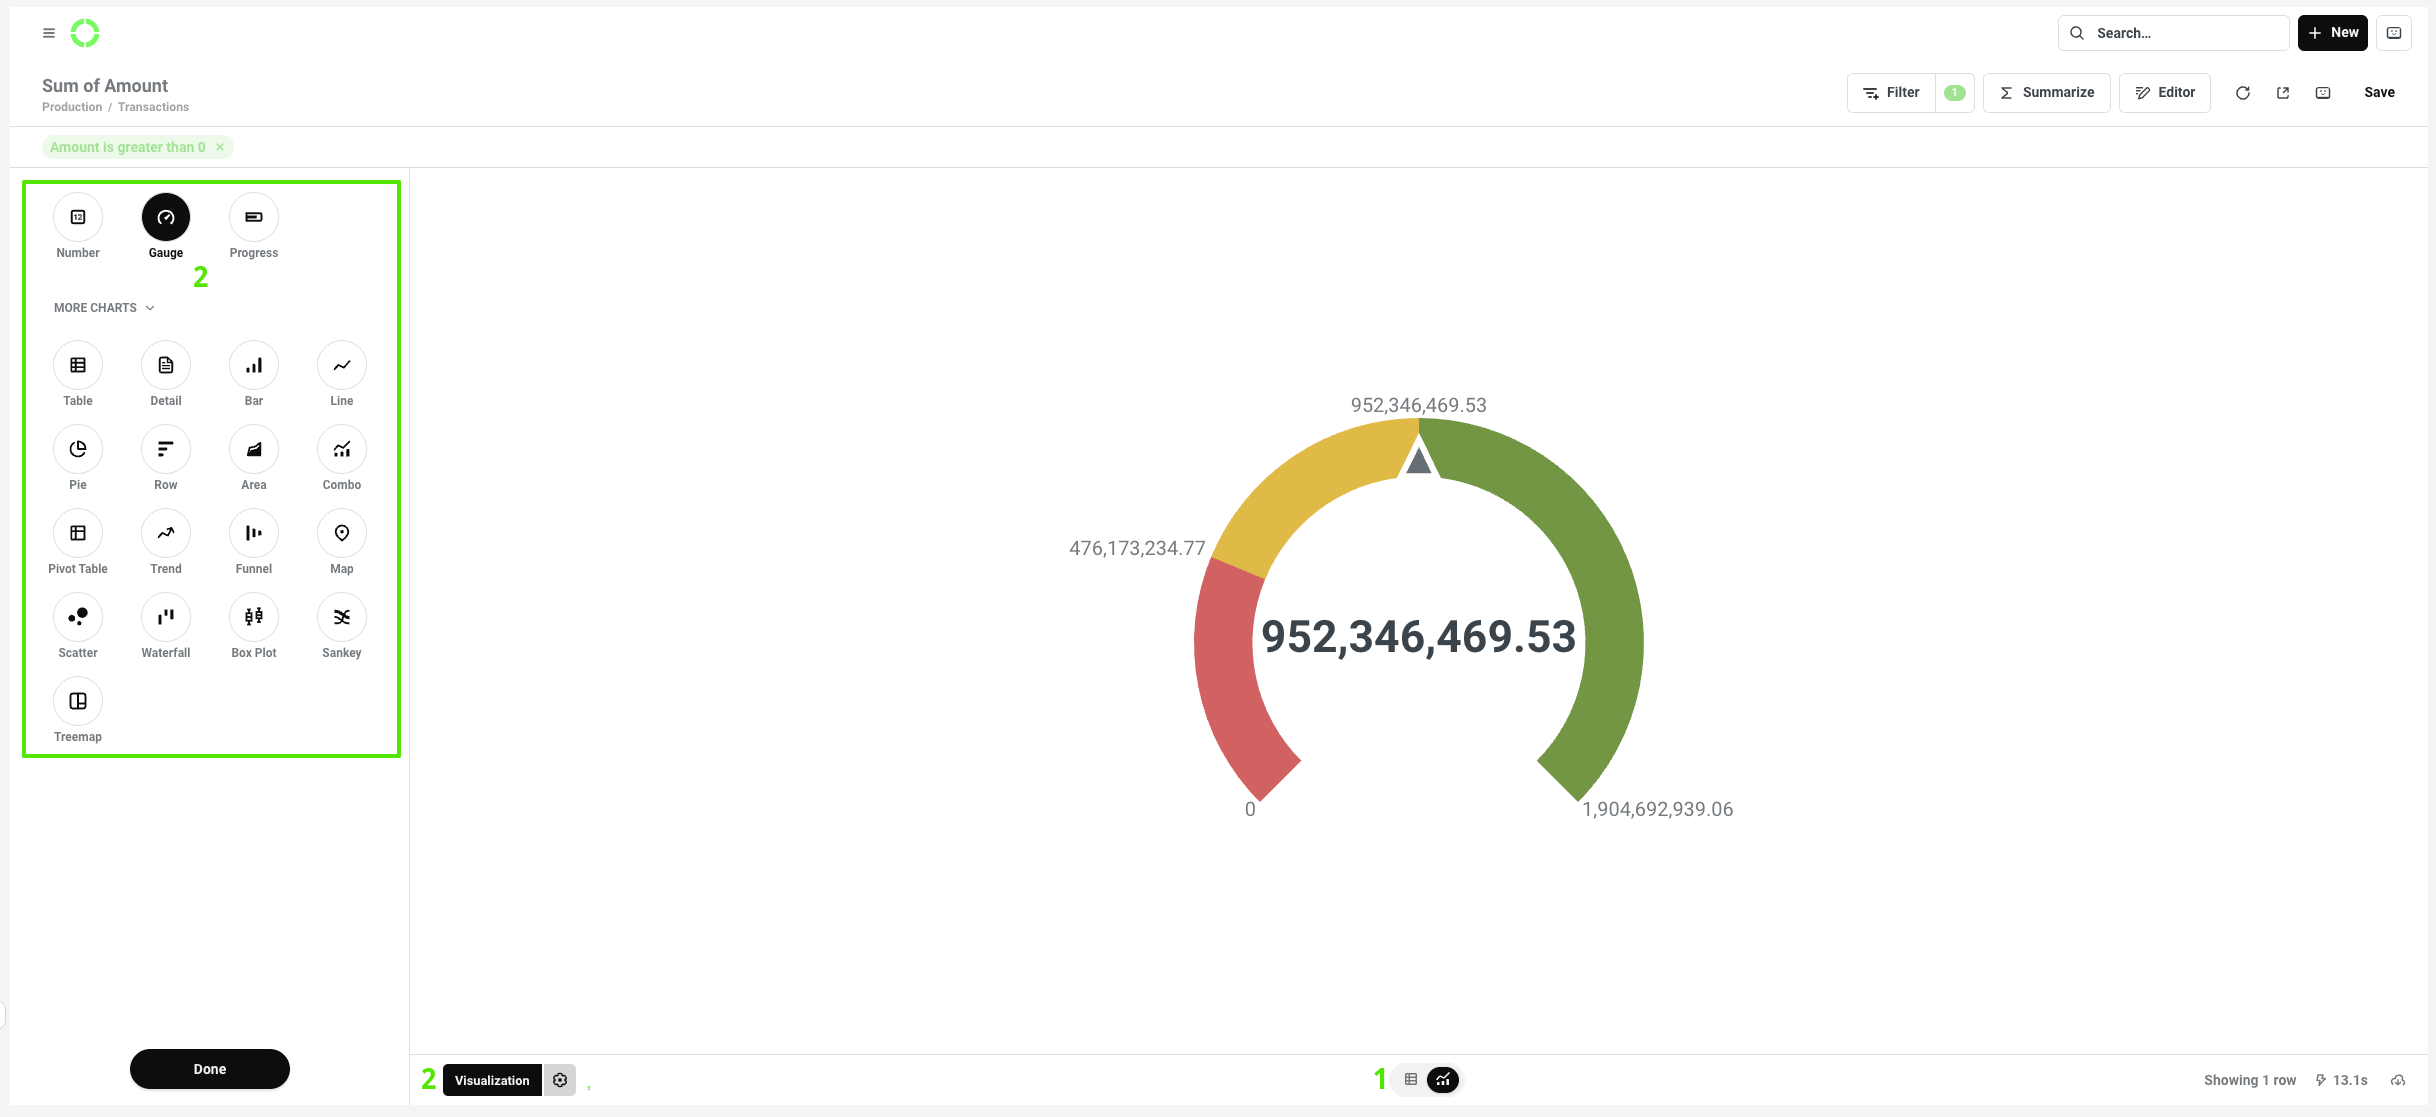
Here you can adjust visual and display settings:
1 - change chart to table2 - select a chart type (Visualization)3 - by clicking the cog ⚙️ you enter the: Data, Display, Axes options
Once done, click Save in the top-right corner.
All activated coupons:
To create a Questions go to Analytics > Databases > Production > User coupon
Use filter: 1 "Is Activated = True" Click 2 Summarize and choose in Summarize by: 3 "Count", in Group by 4 "COUPON -> Name"
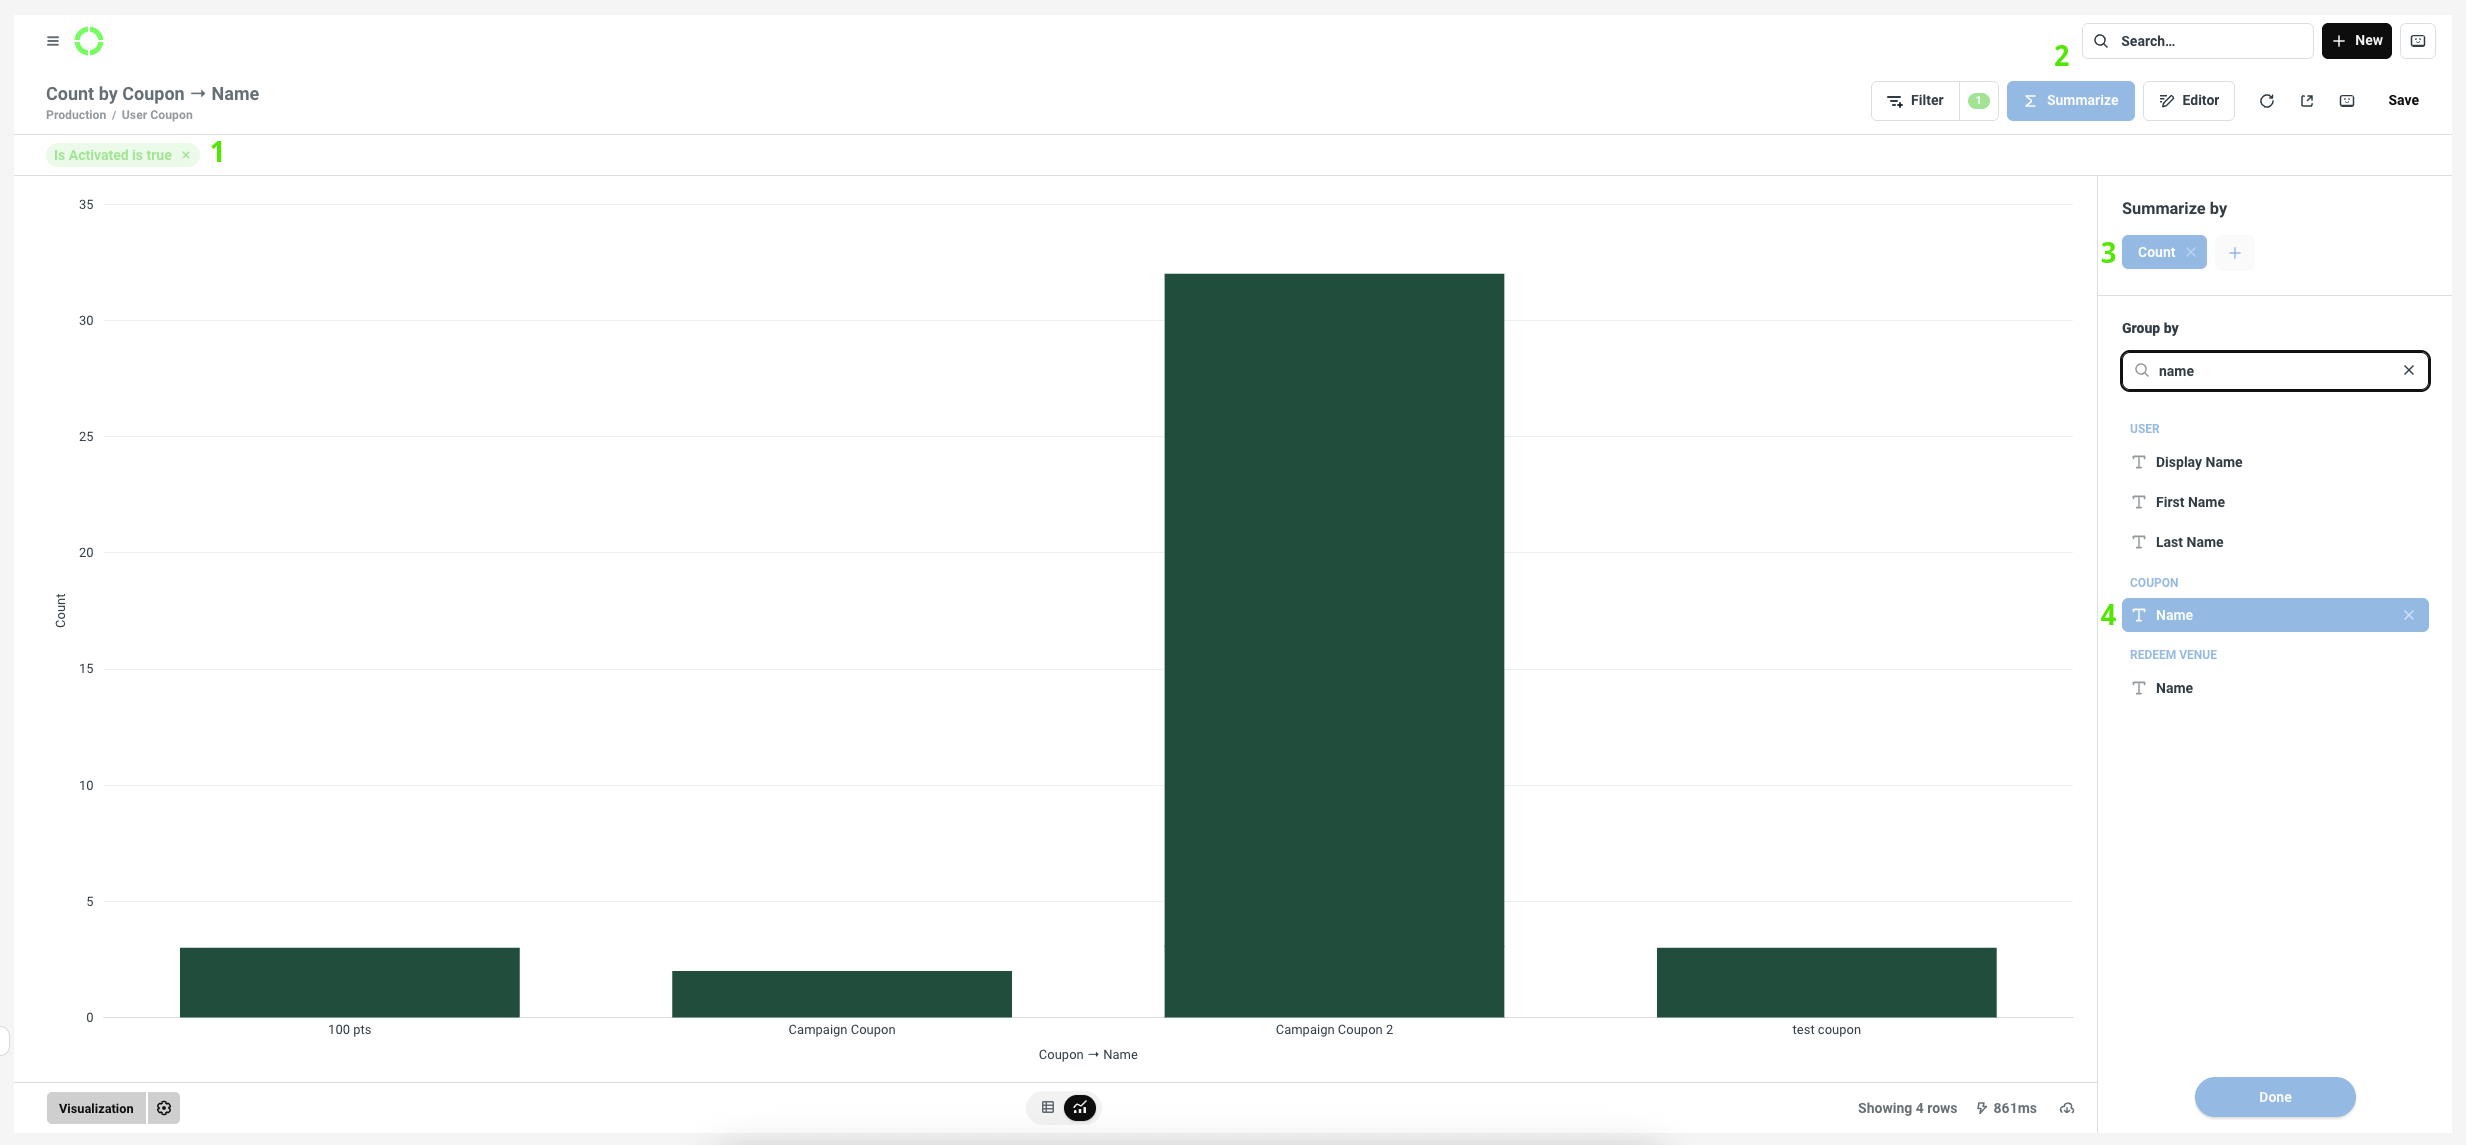
The EDITOR preview will look like this:
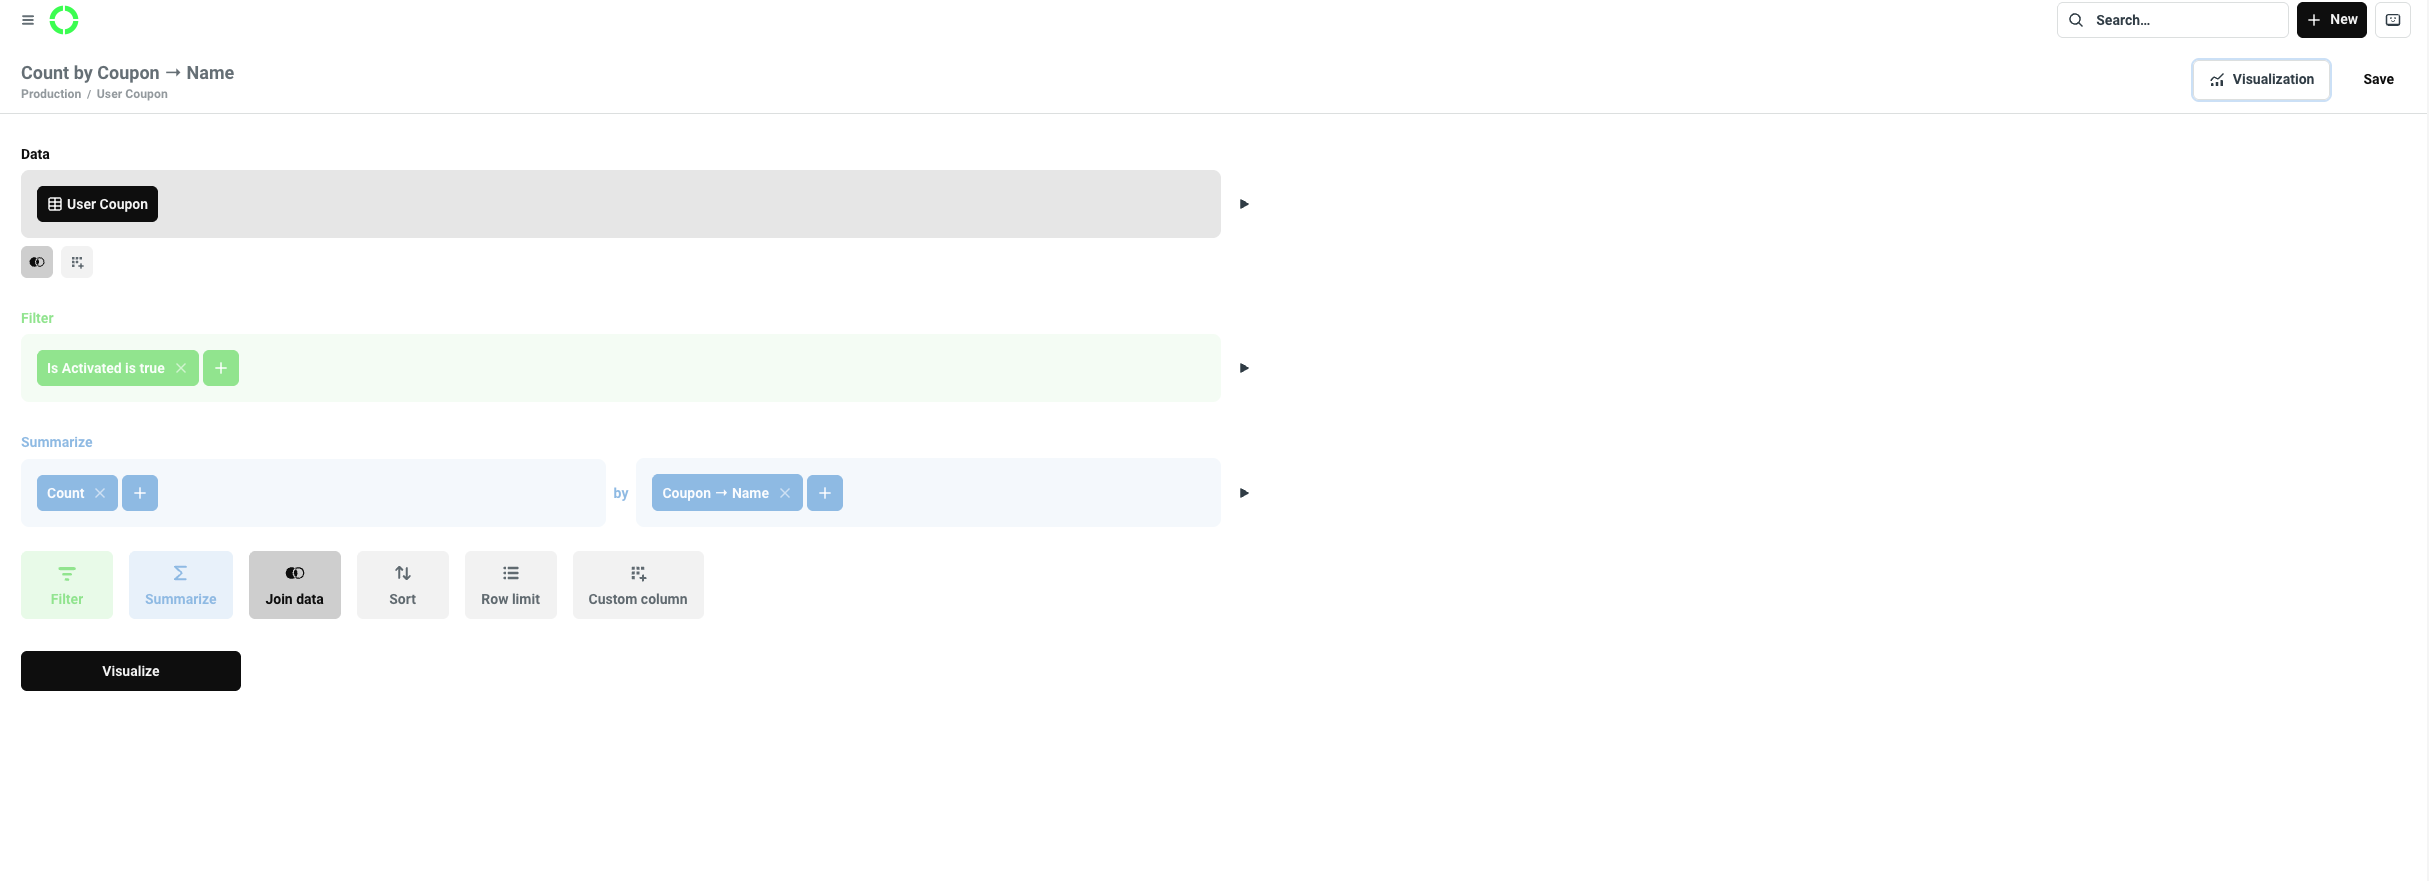
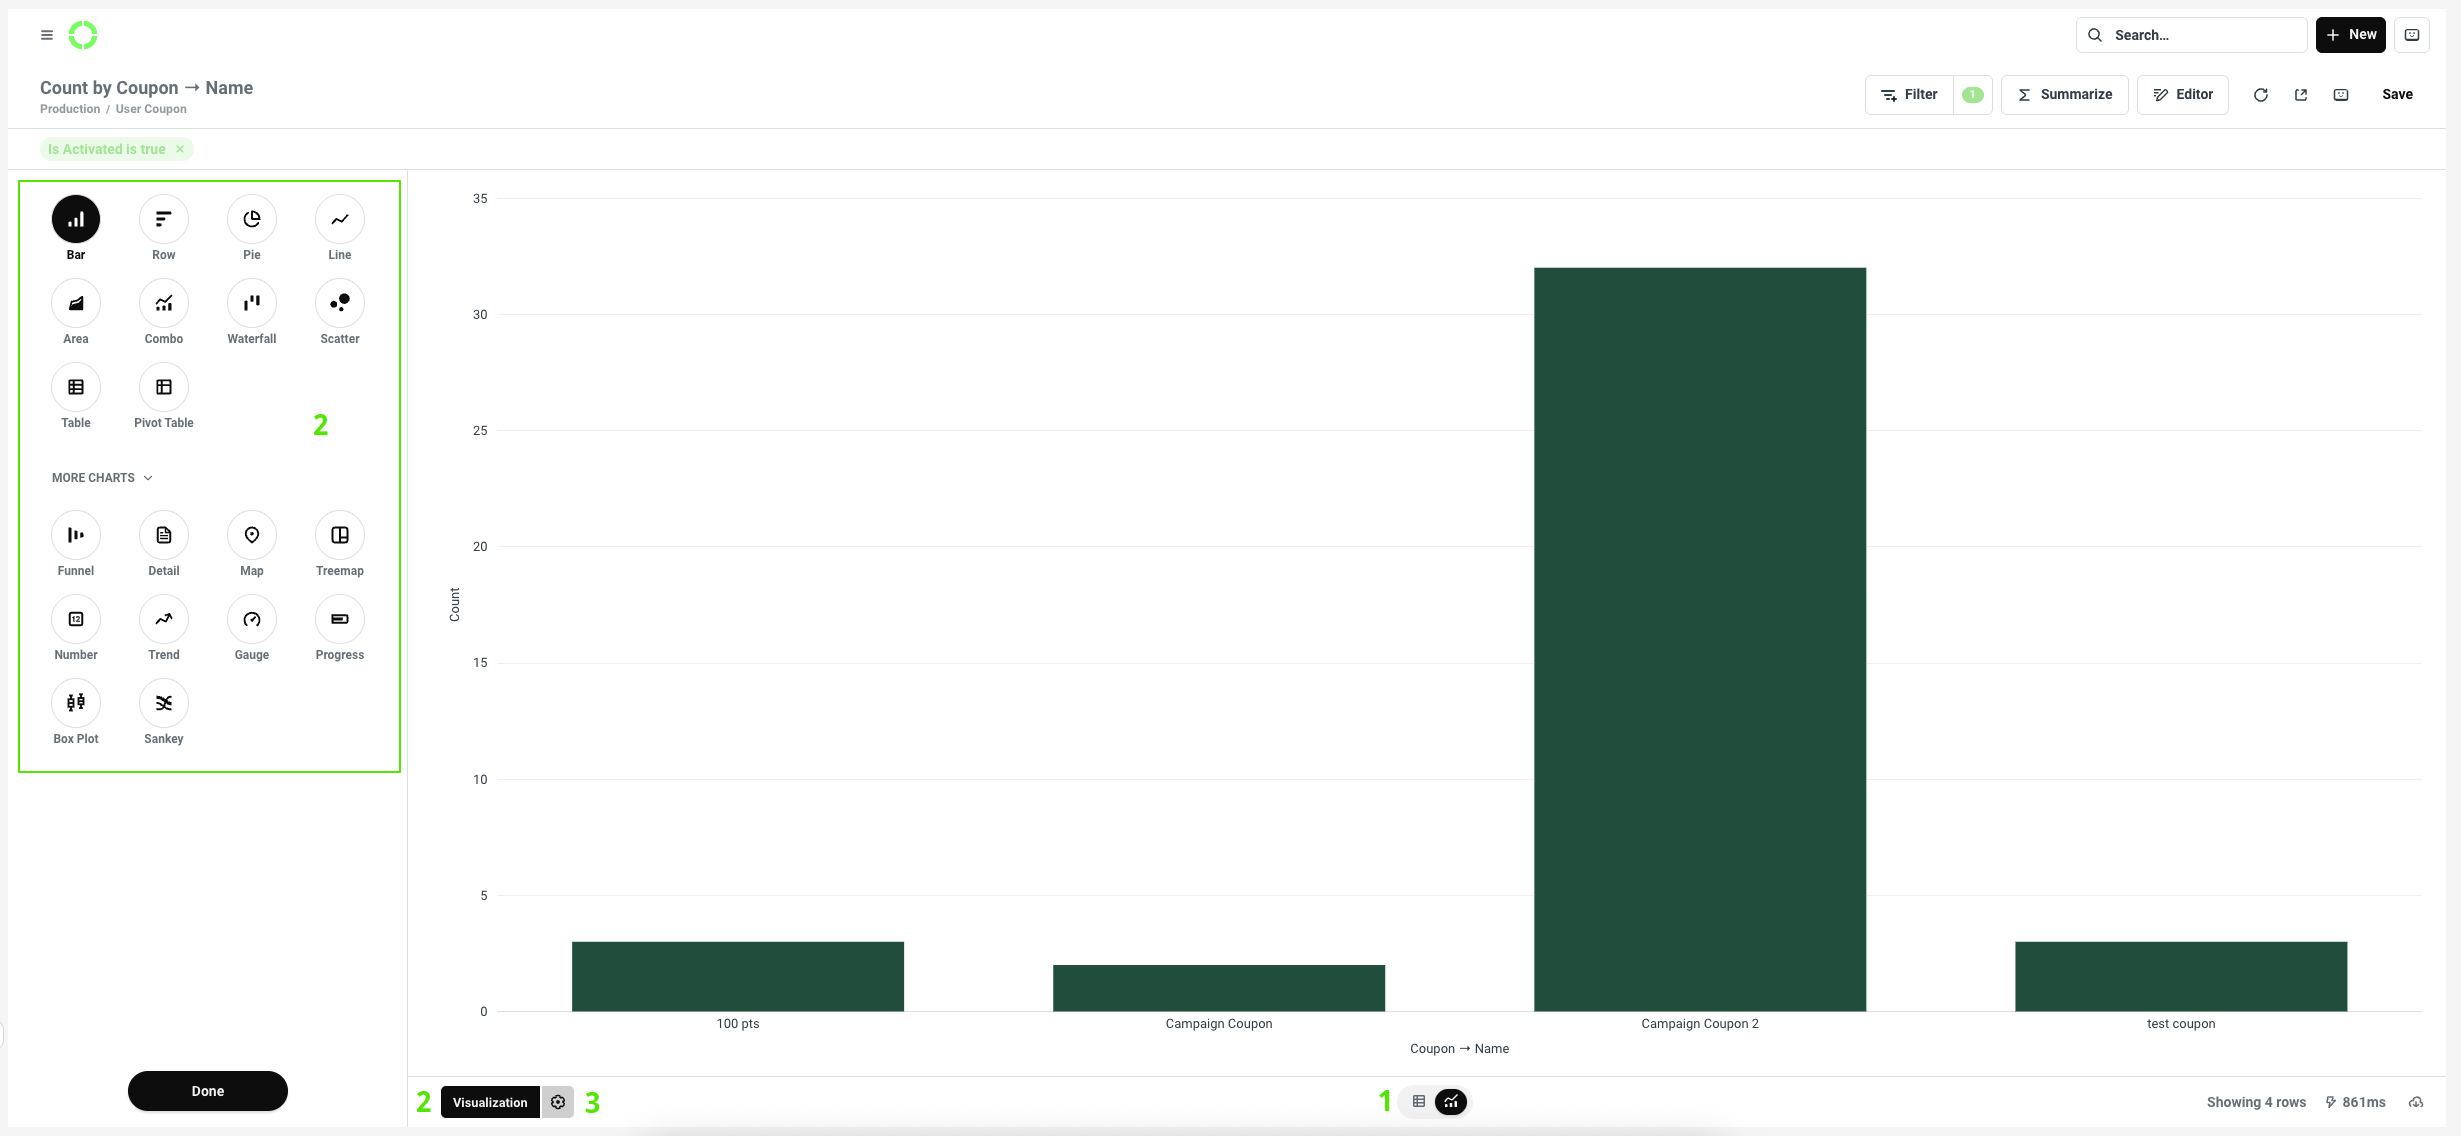
Here you can adjust visual and display settings:
1 - change chart to table2 - select a chart type (Visualization)3 - by clicking the cog ⚙️ you enter the: Data, Display, Axes options
Once done, click Save in the top-right corner.
All redeemed coupons:
To create a Questions go to Analytics > Databases > Production > User coupon
Use filter: 1 "Is Redeemed = True" Click 2 Summarize and choose in Summarize by: 3 "Count", in Group by 4 "COUPON -> Name"
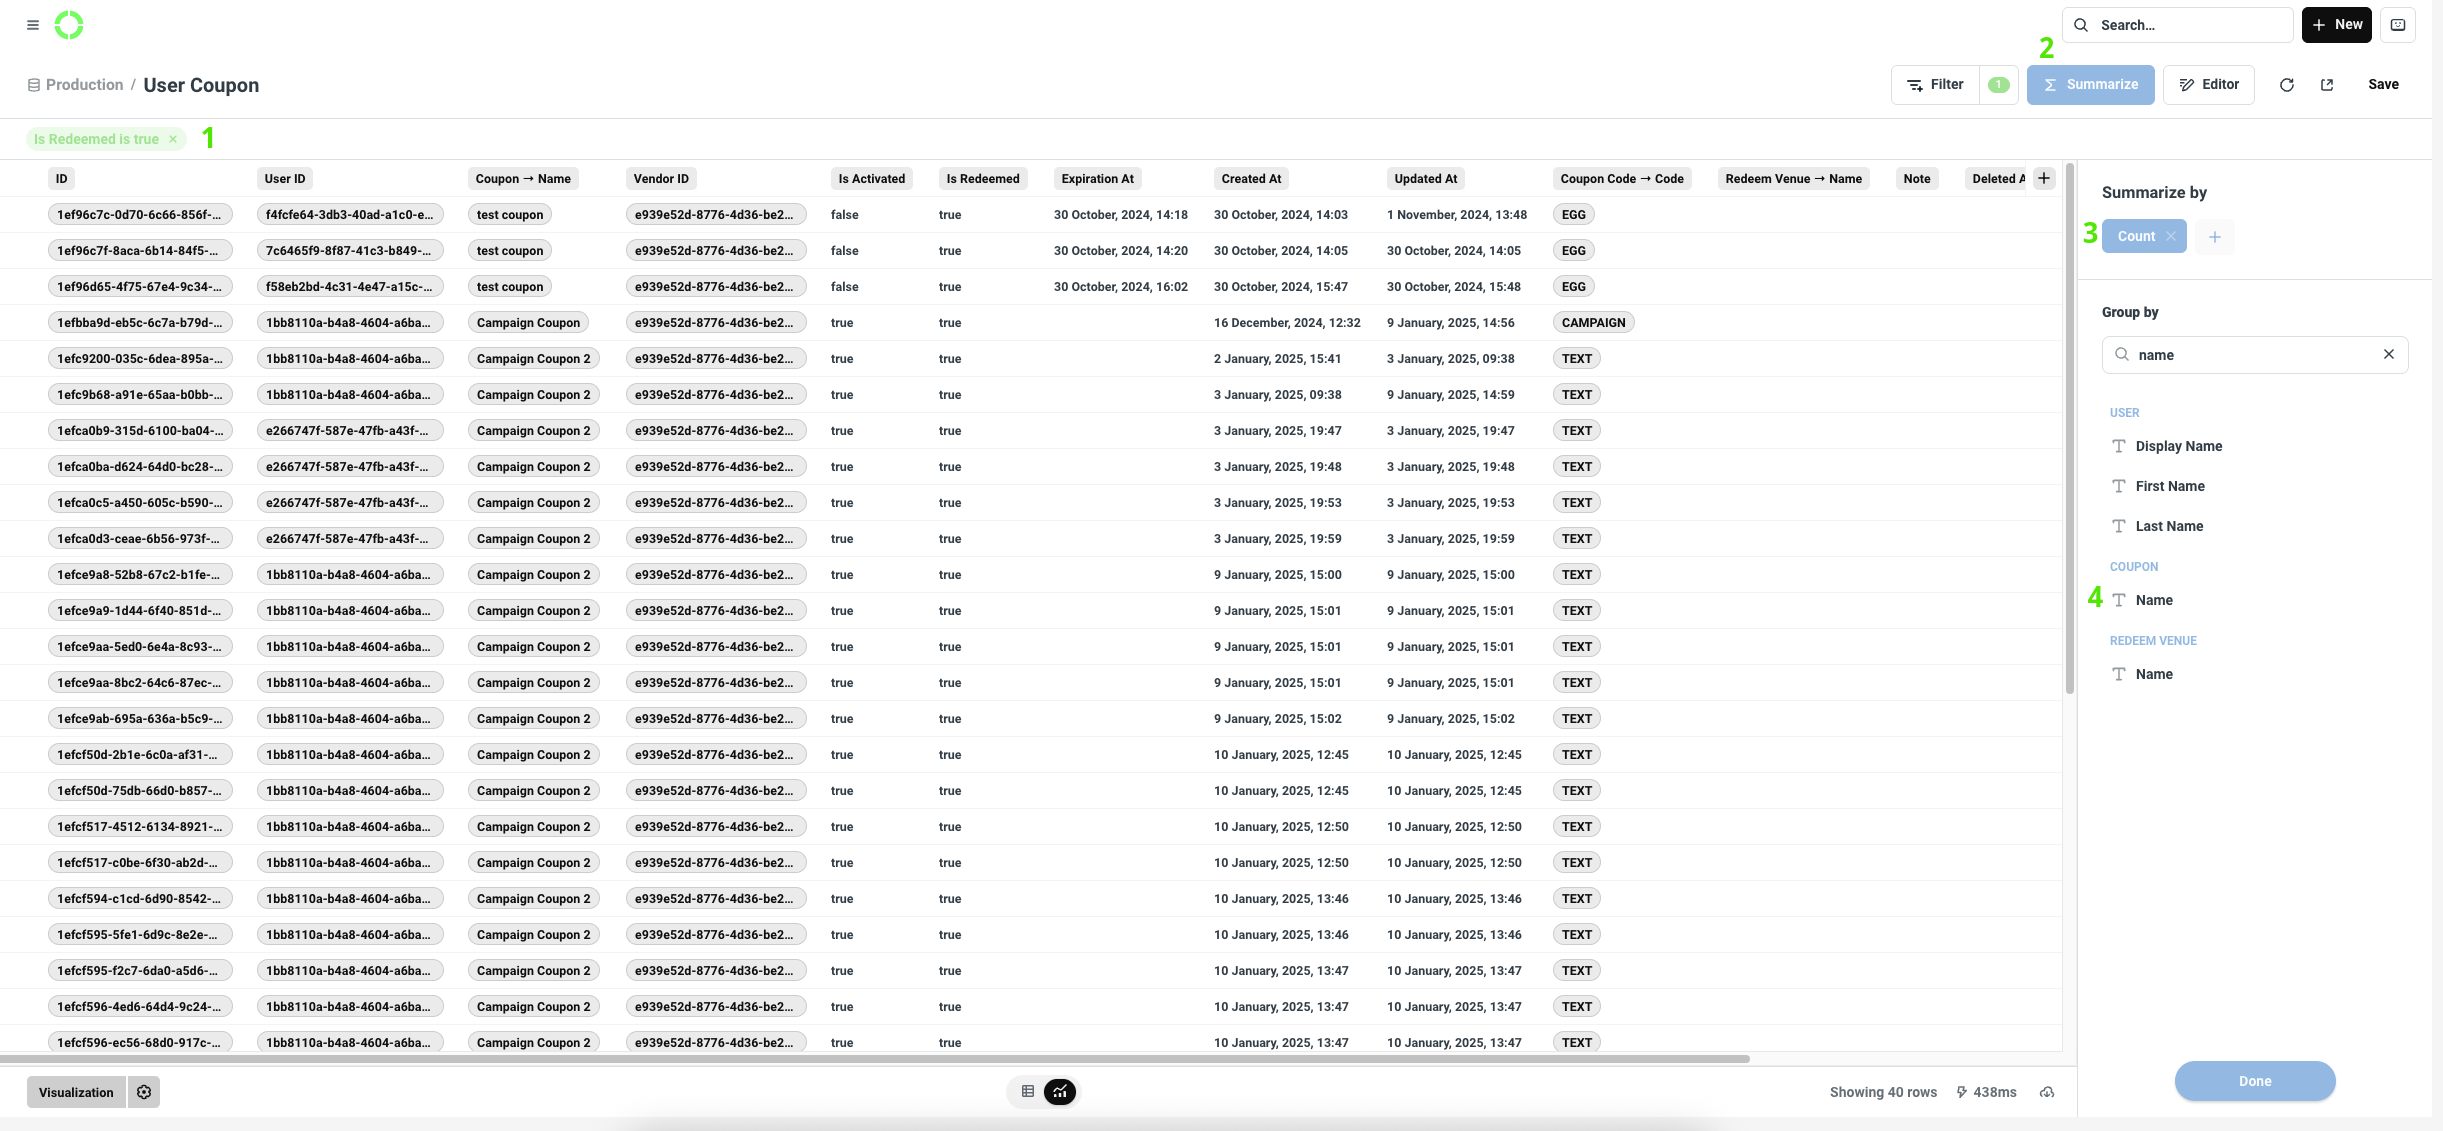
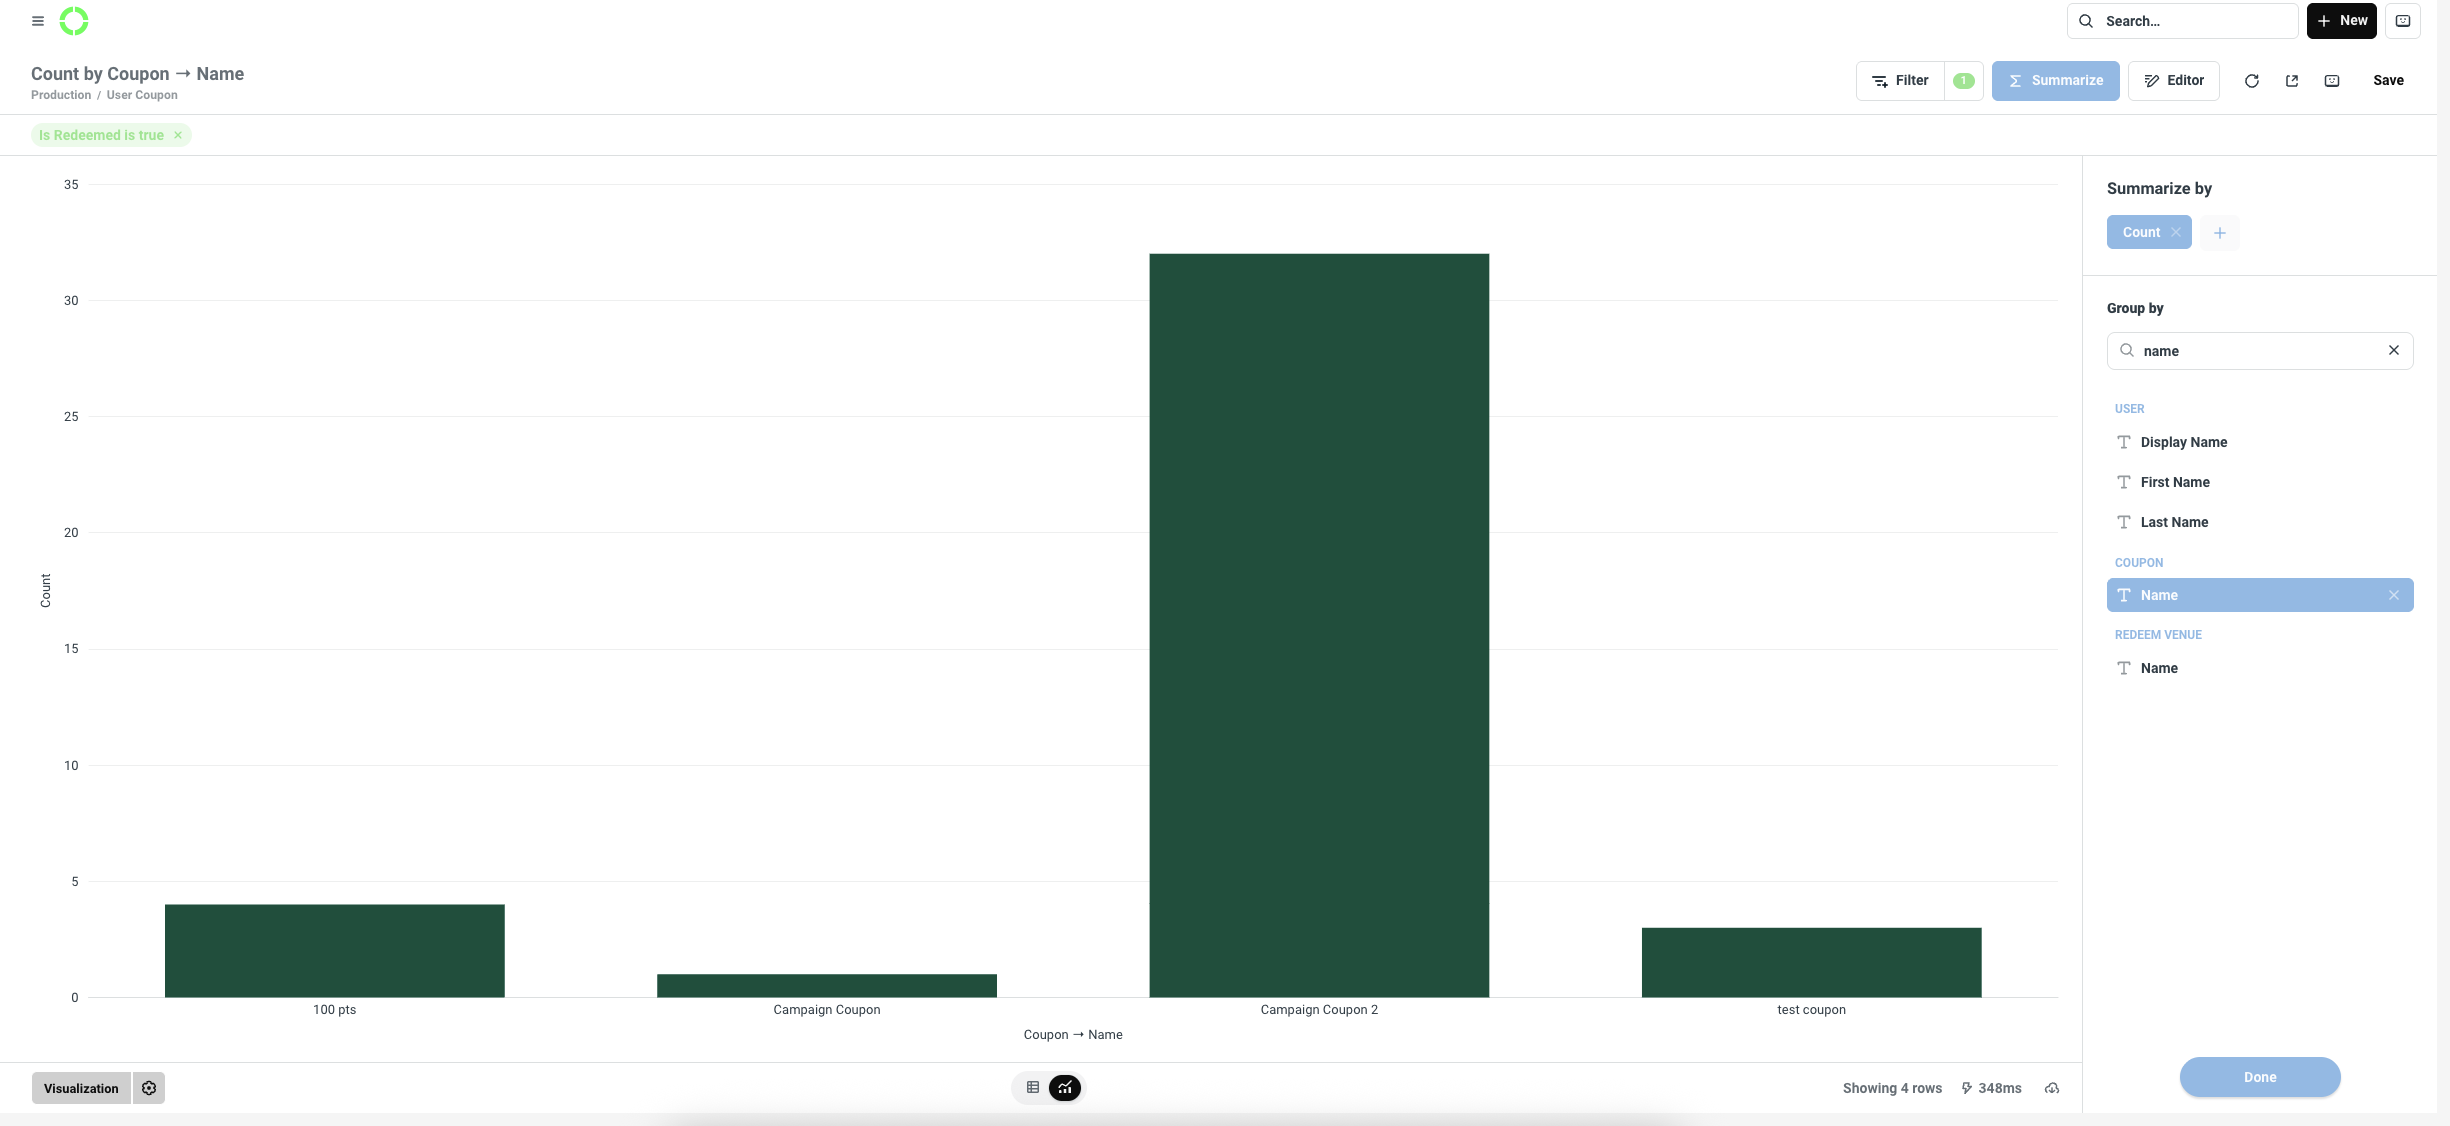
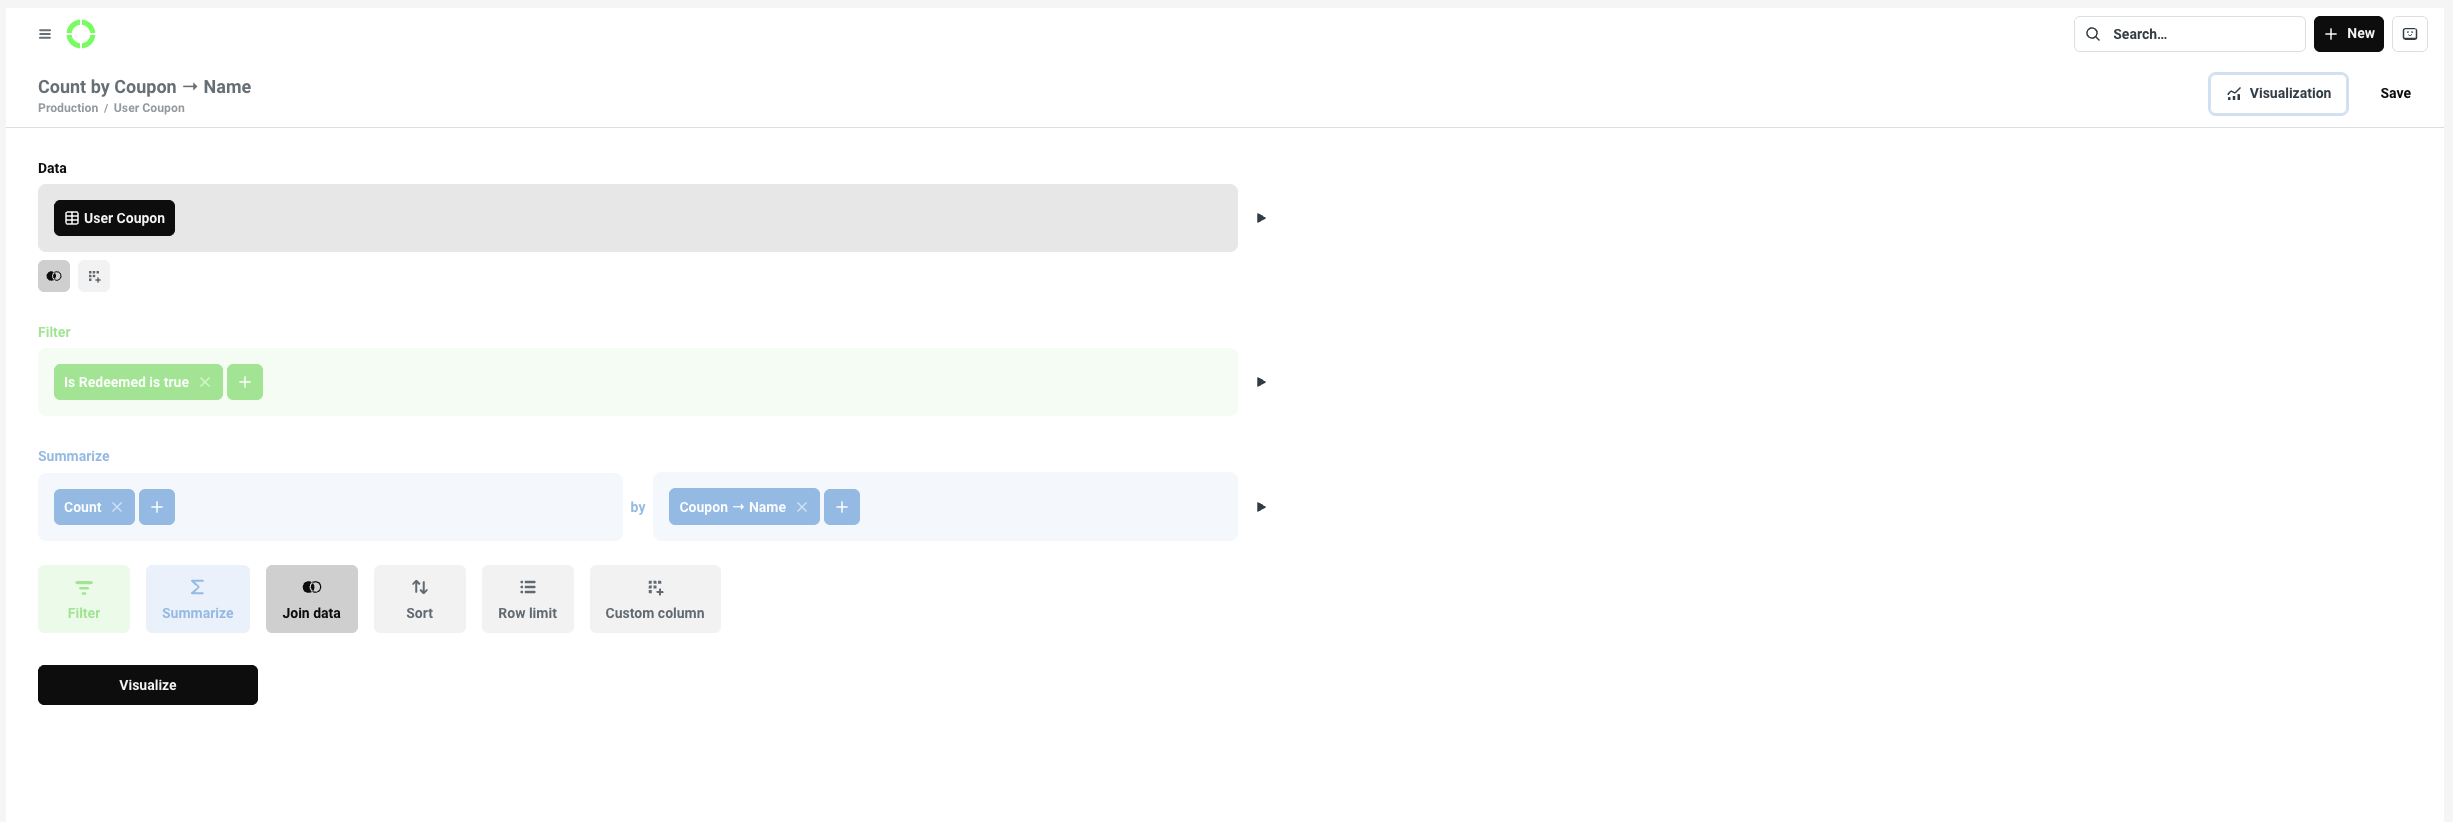
The EDITOR preview will look like this:
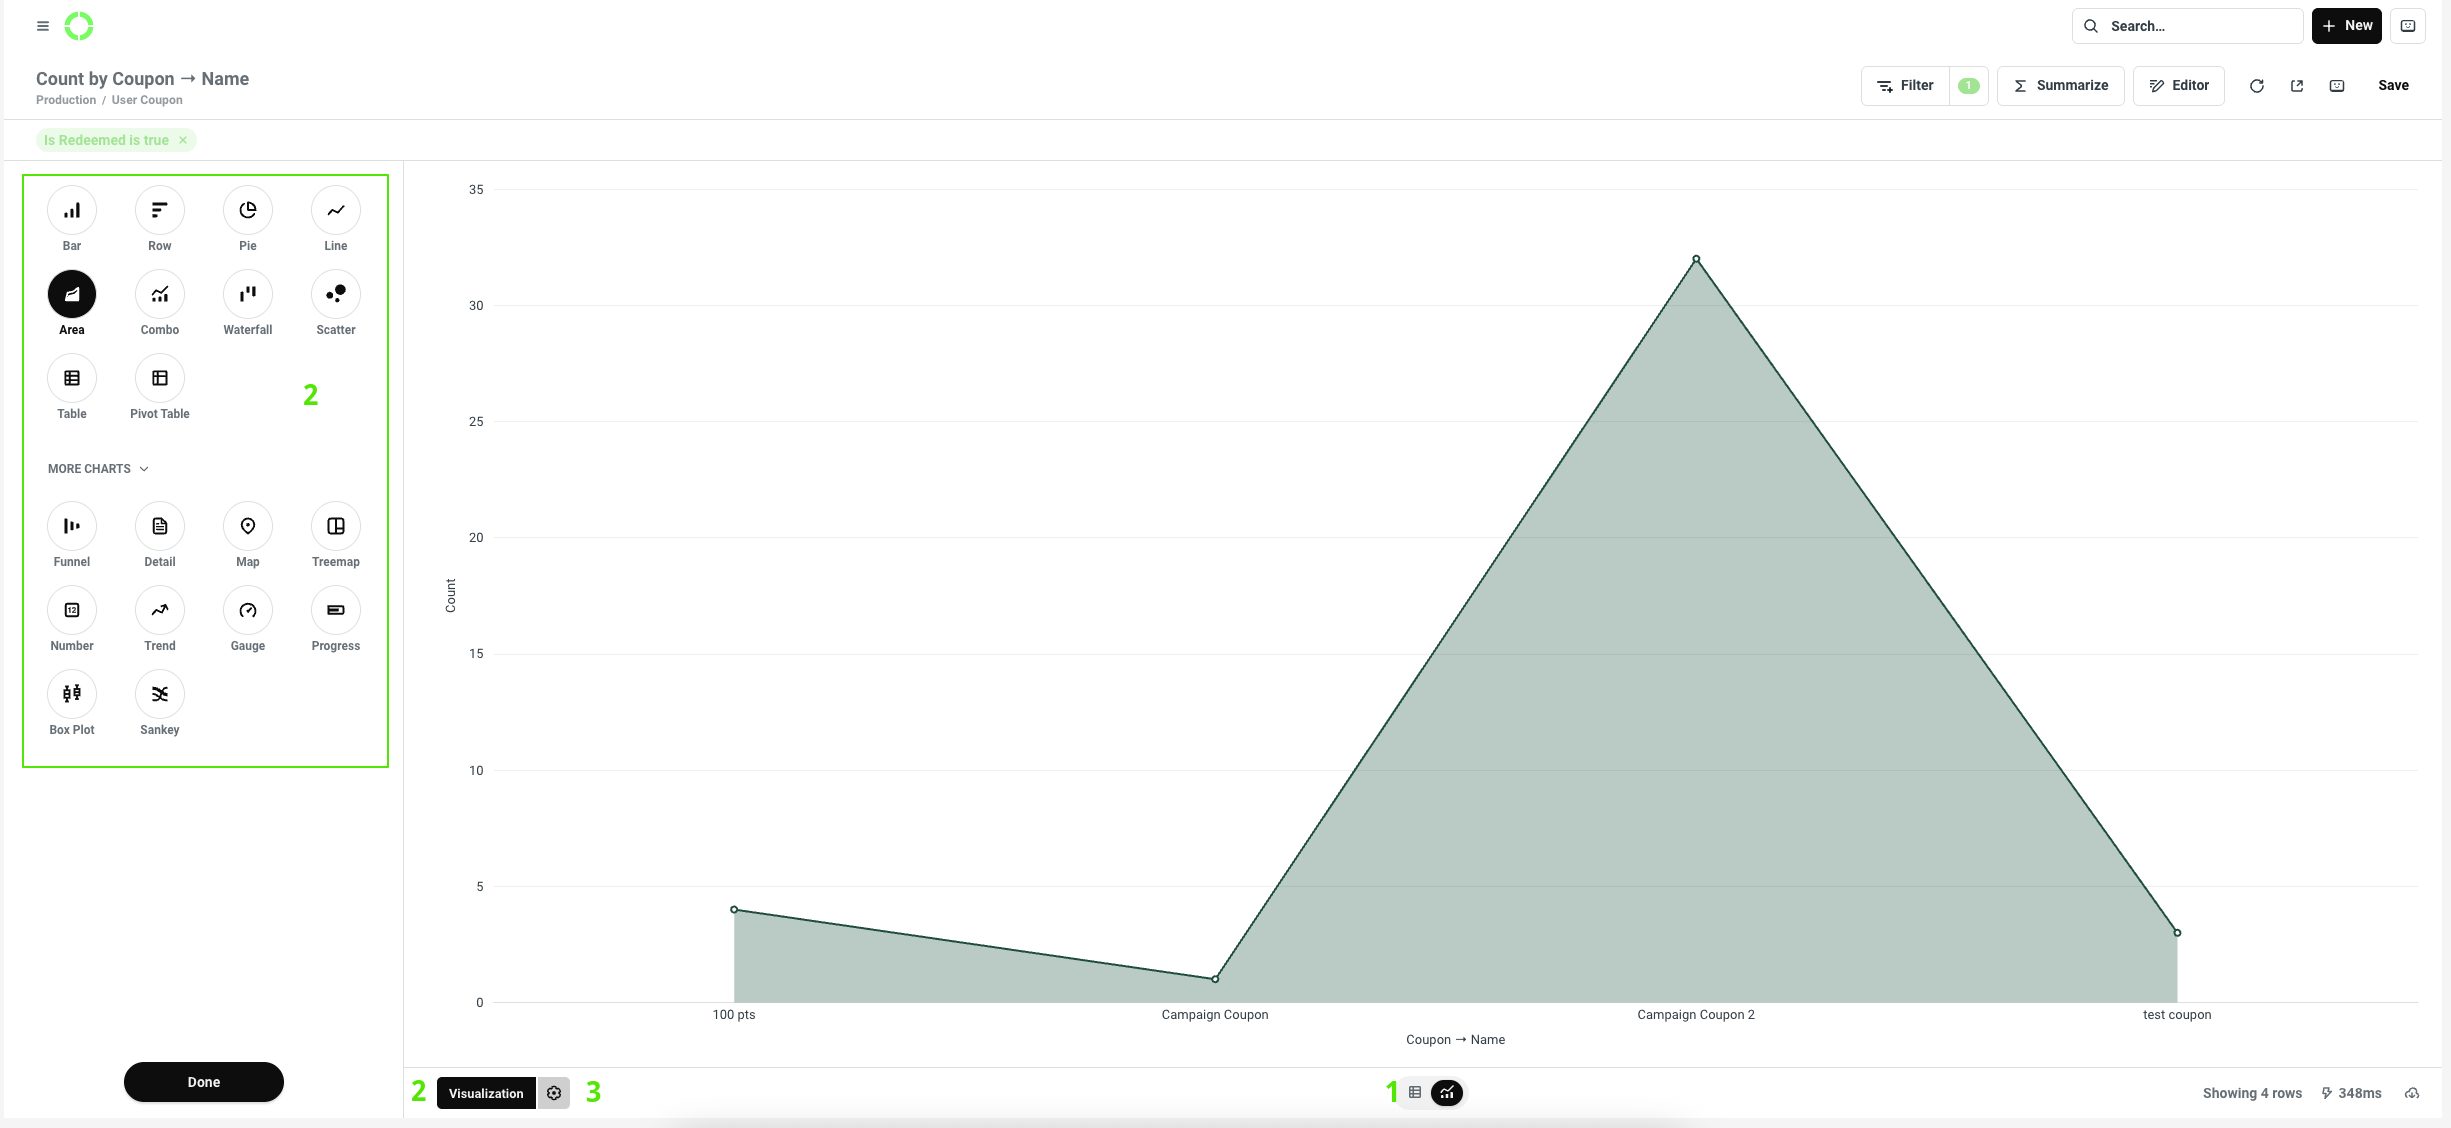
Here you can adjust visual and display settings:
1 - change chart to table2 - select a chart type (Visualization)3 - by clicking the cog ⚙️ you enter the: Data, Display, Axes options
Once done, click Save in the top-right corner.
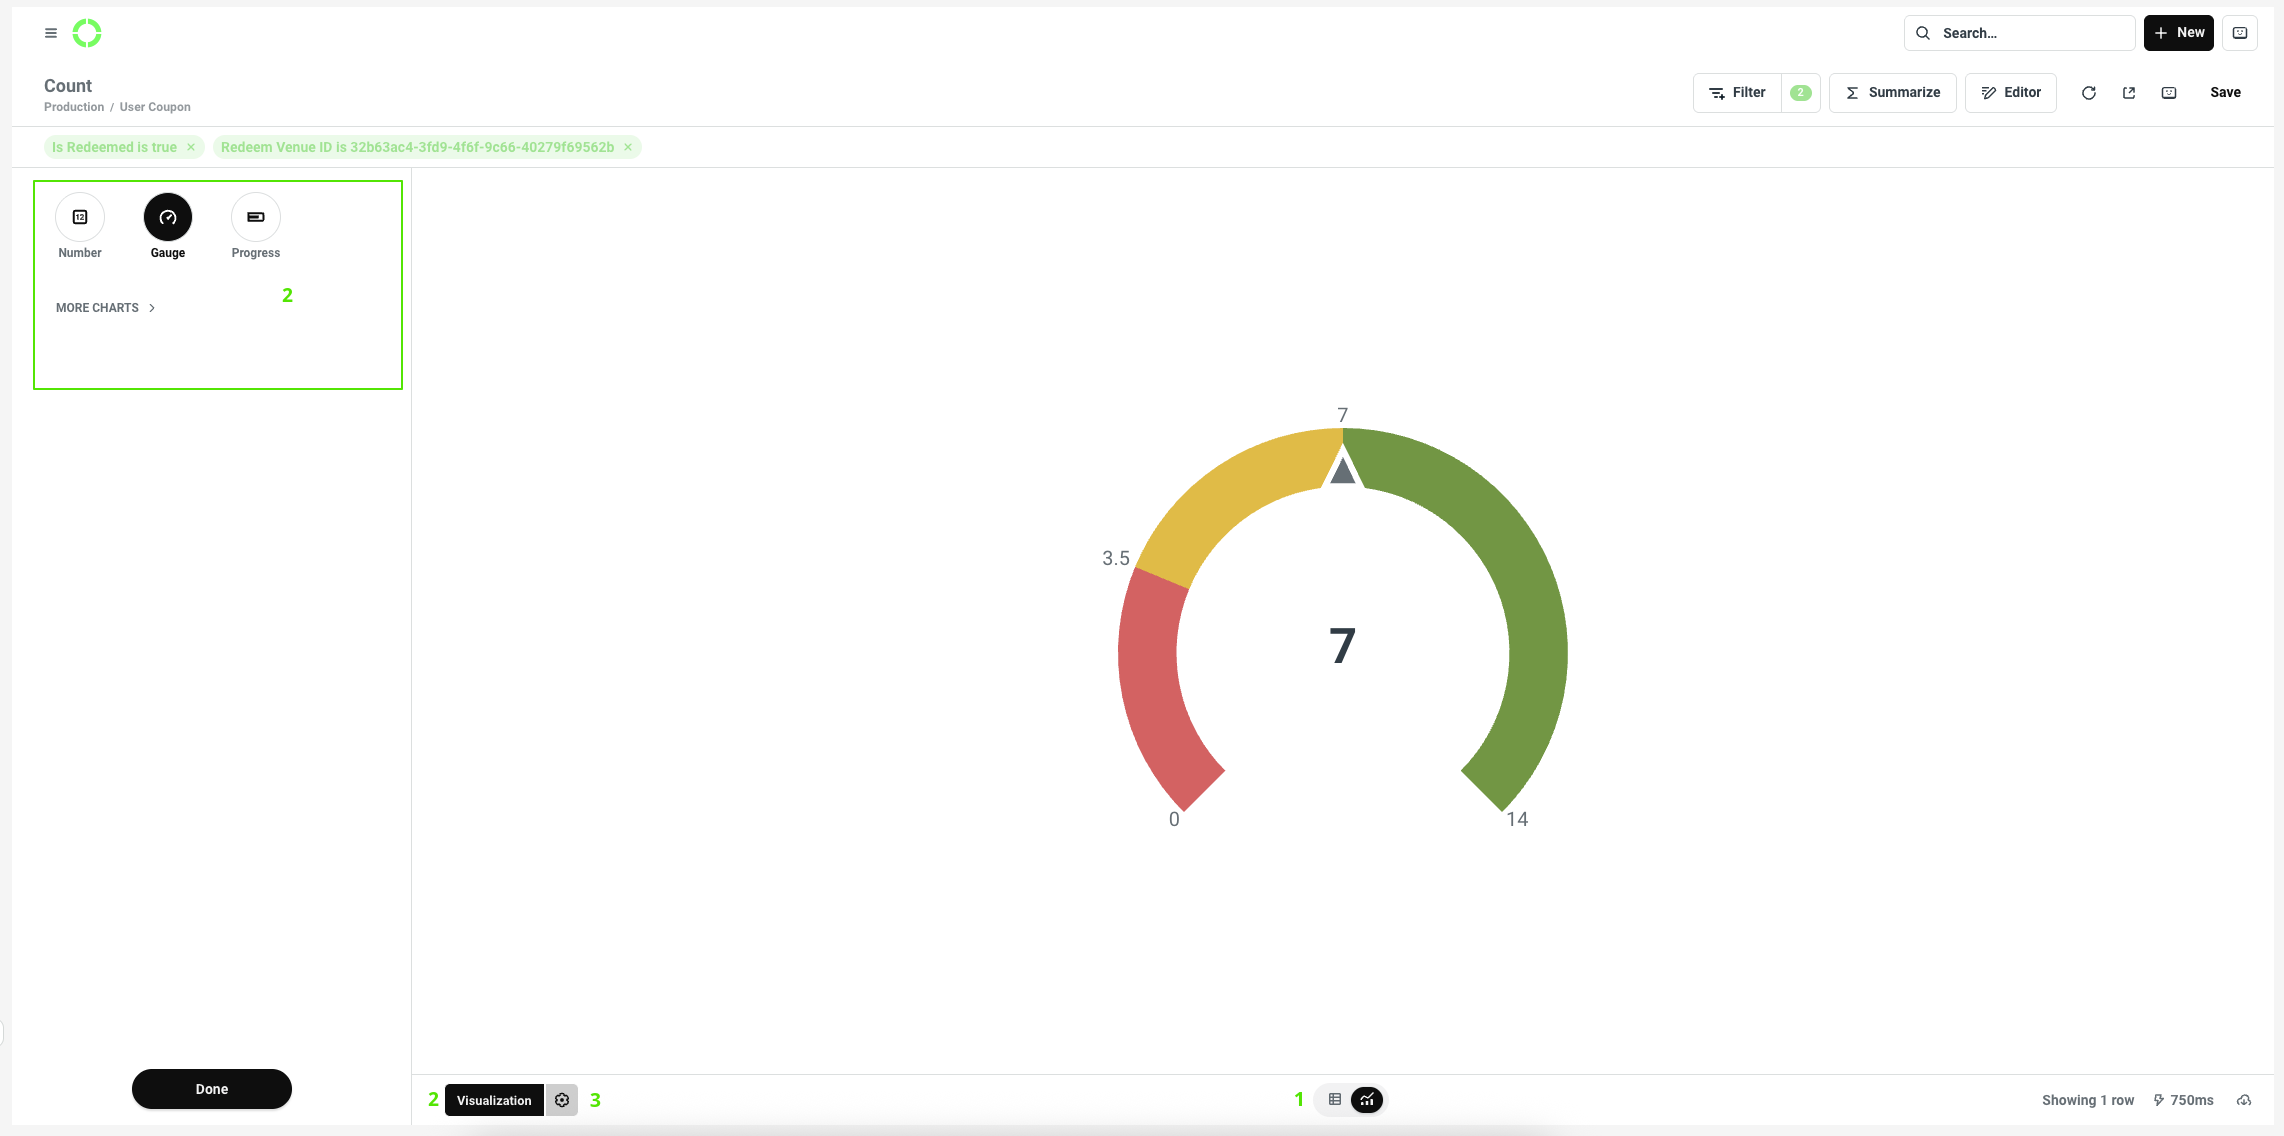
Coupons redeemed by venue:
To create a Questions go to Analytics > Databases > Production > User coupon
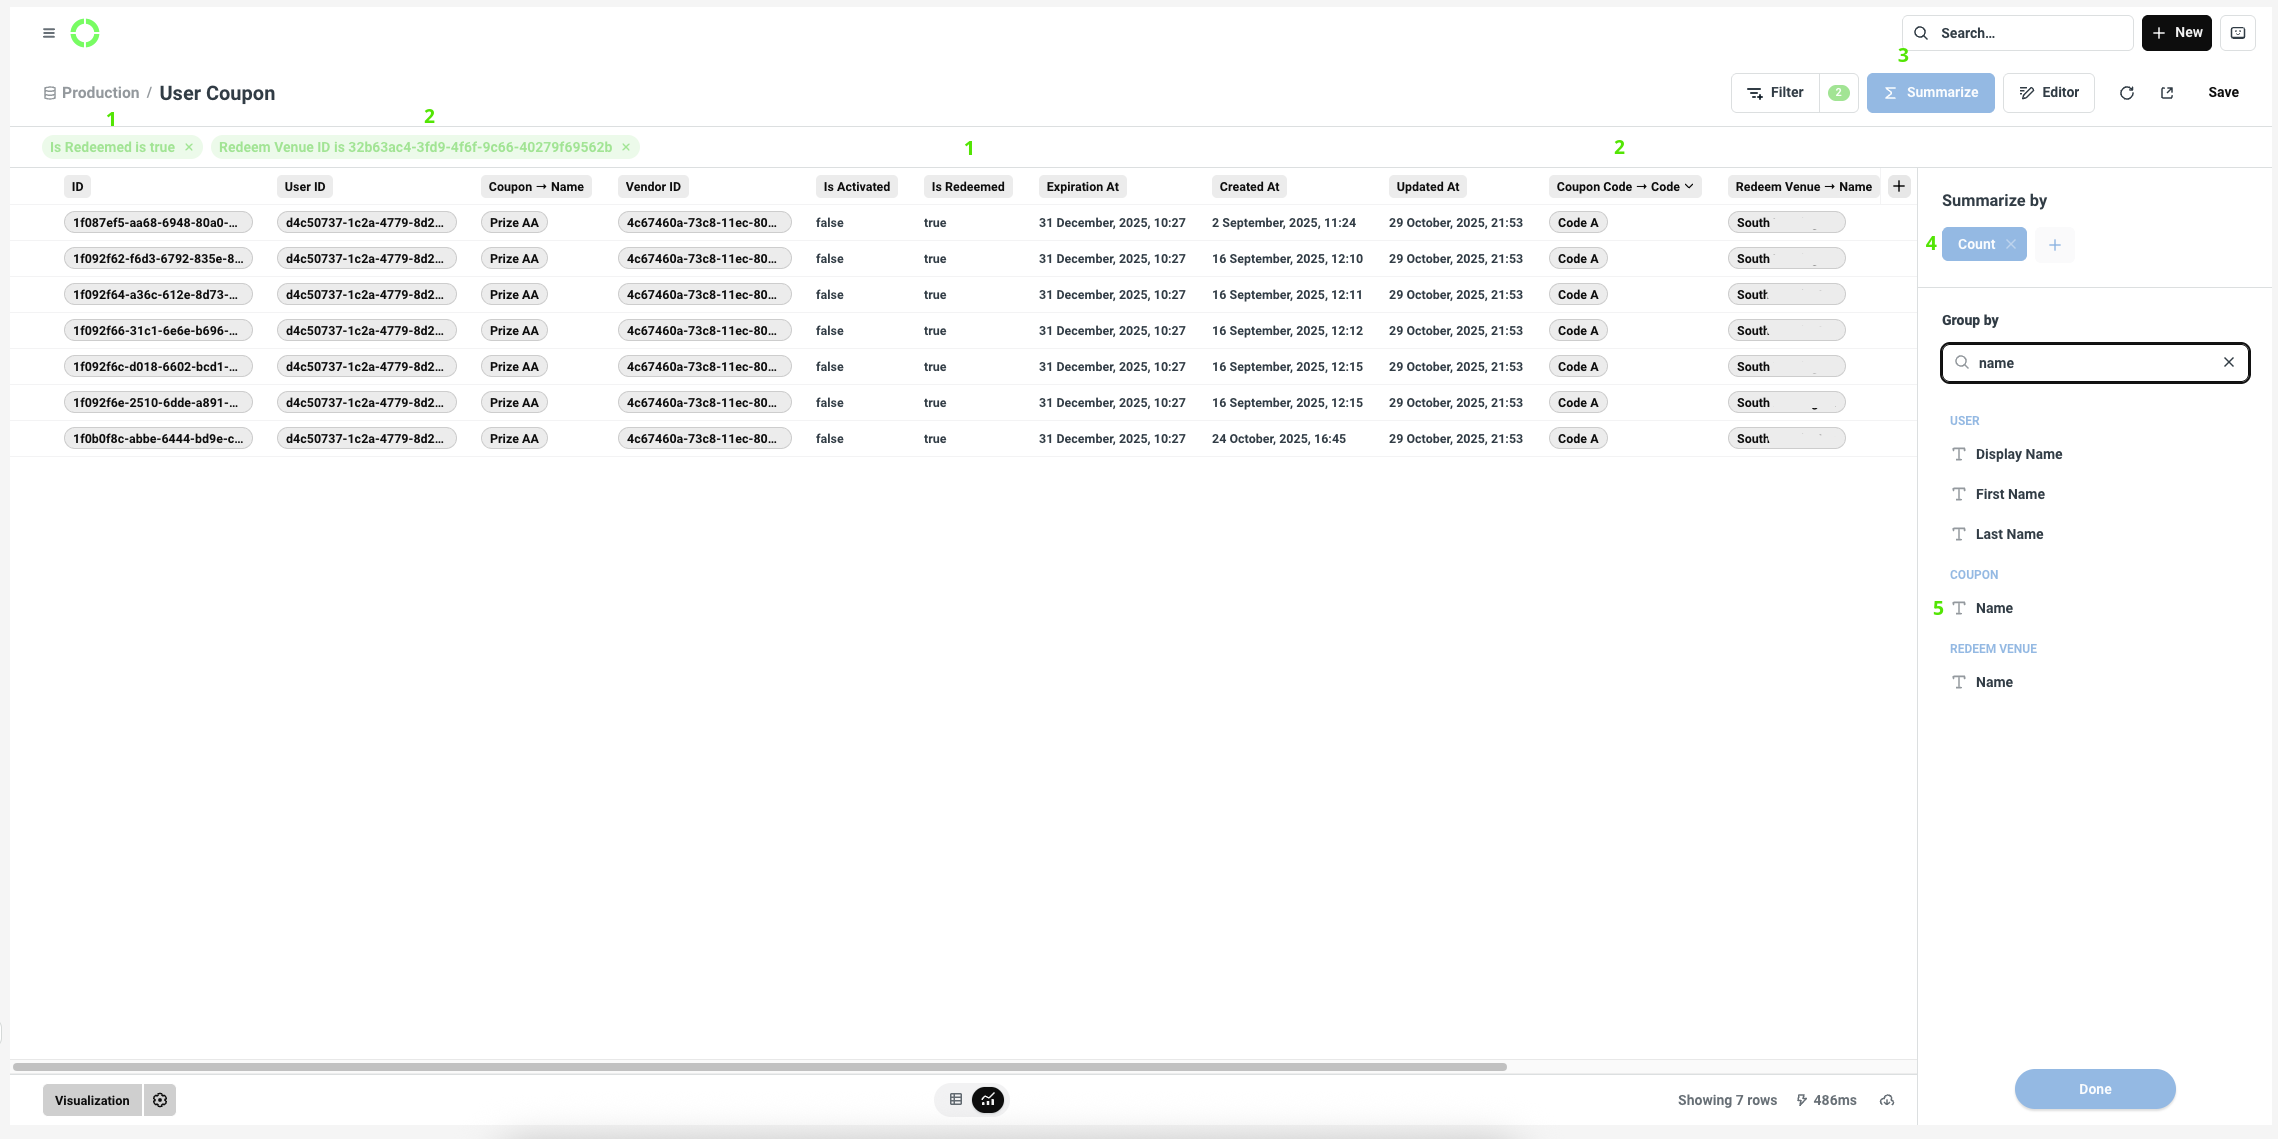
Use filter: 1 "Is Redeemed = True" 2 "Redeem Venue -> Name = Enter the Venue(name or ID) you are interested in"
Click 3 Summarize and choose in Summarize by: 4 "Count", in Group by 5 "COUPON -> Name"
Here you can adjust visual and display settings:
1 - change chart to table2 - select a chart type (Visualization)3 - by clicking the cog ⚙️ you enter the: Data, Display, Axes options
Once done, click Save in the top-right corner.
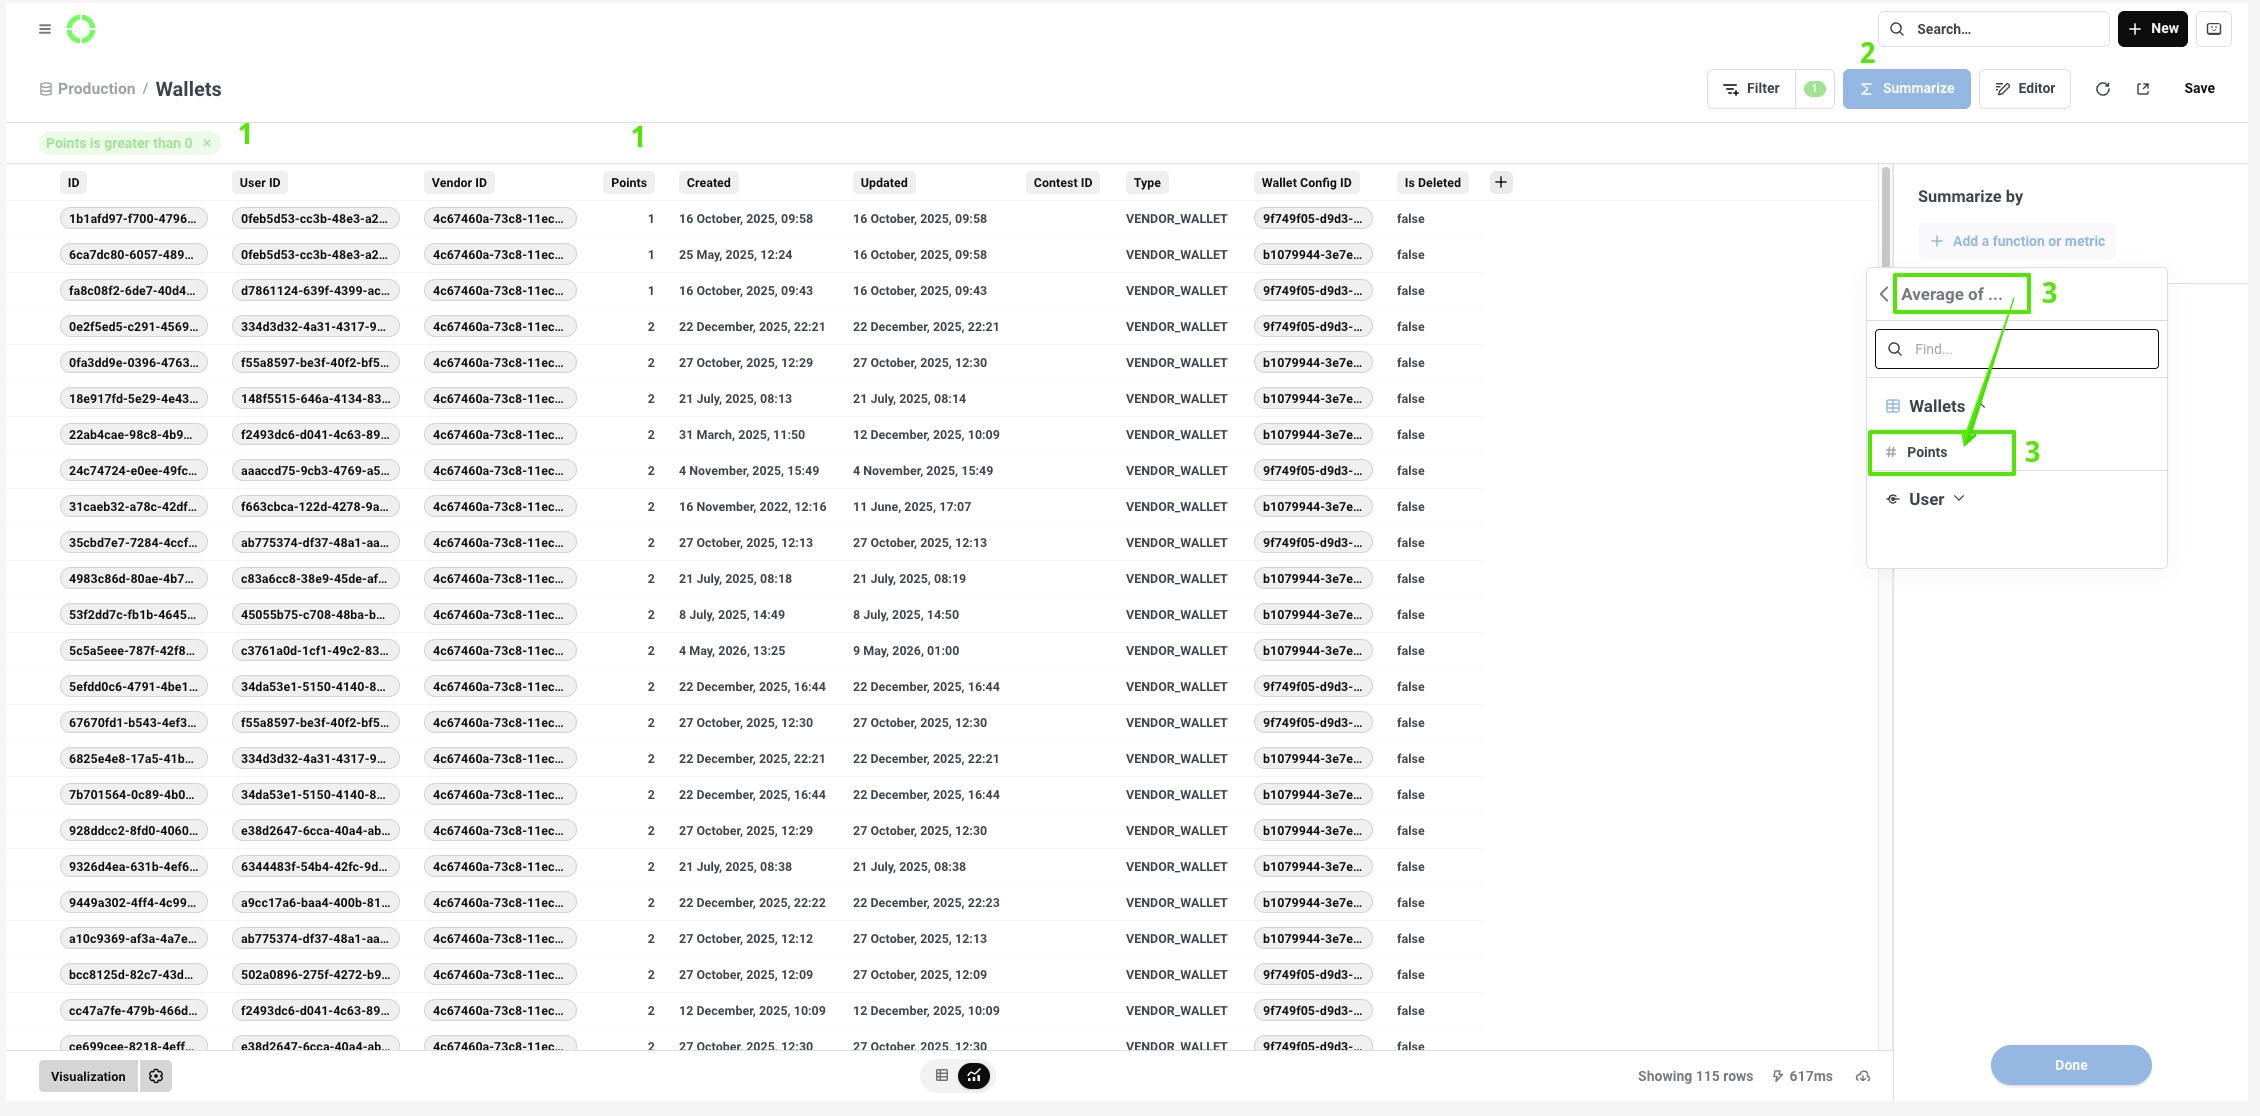
Average Wallets Balance:
To create a Questions go to Analytics > Databases > Production > Wallets
Use filter: 1 "Points = greater than 0" Click 2 Summarize and choose in Summarize by: 3 "Average of Points"
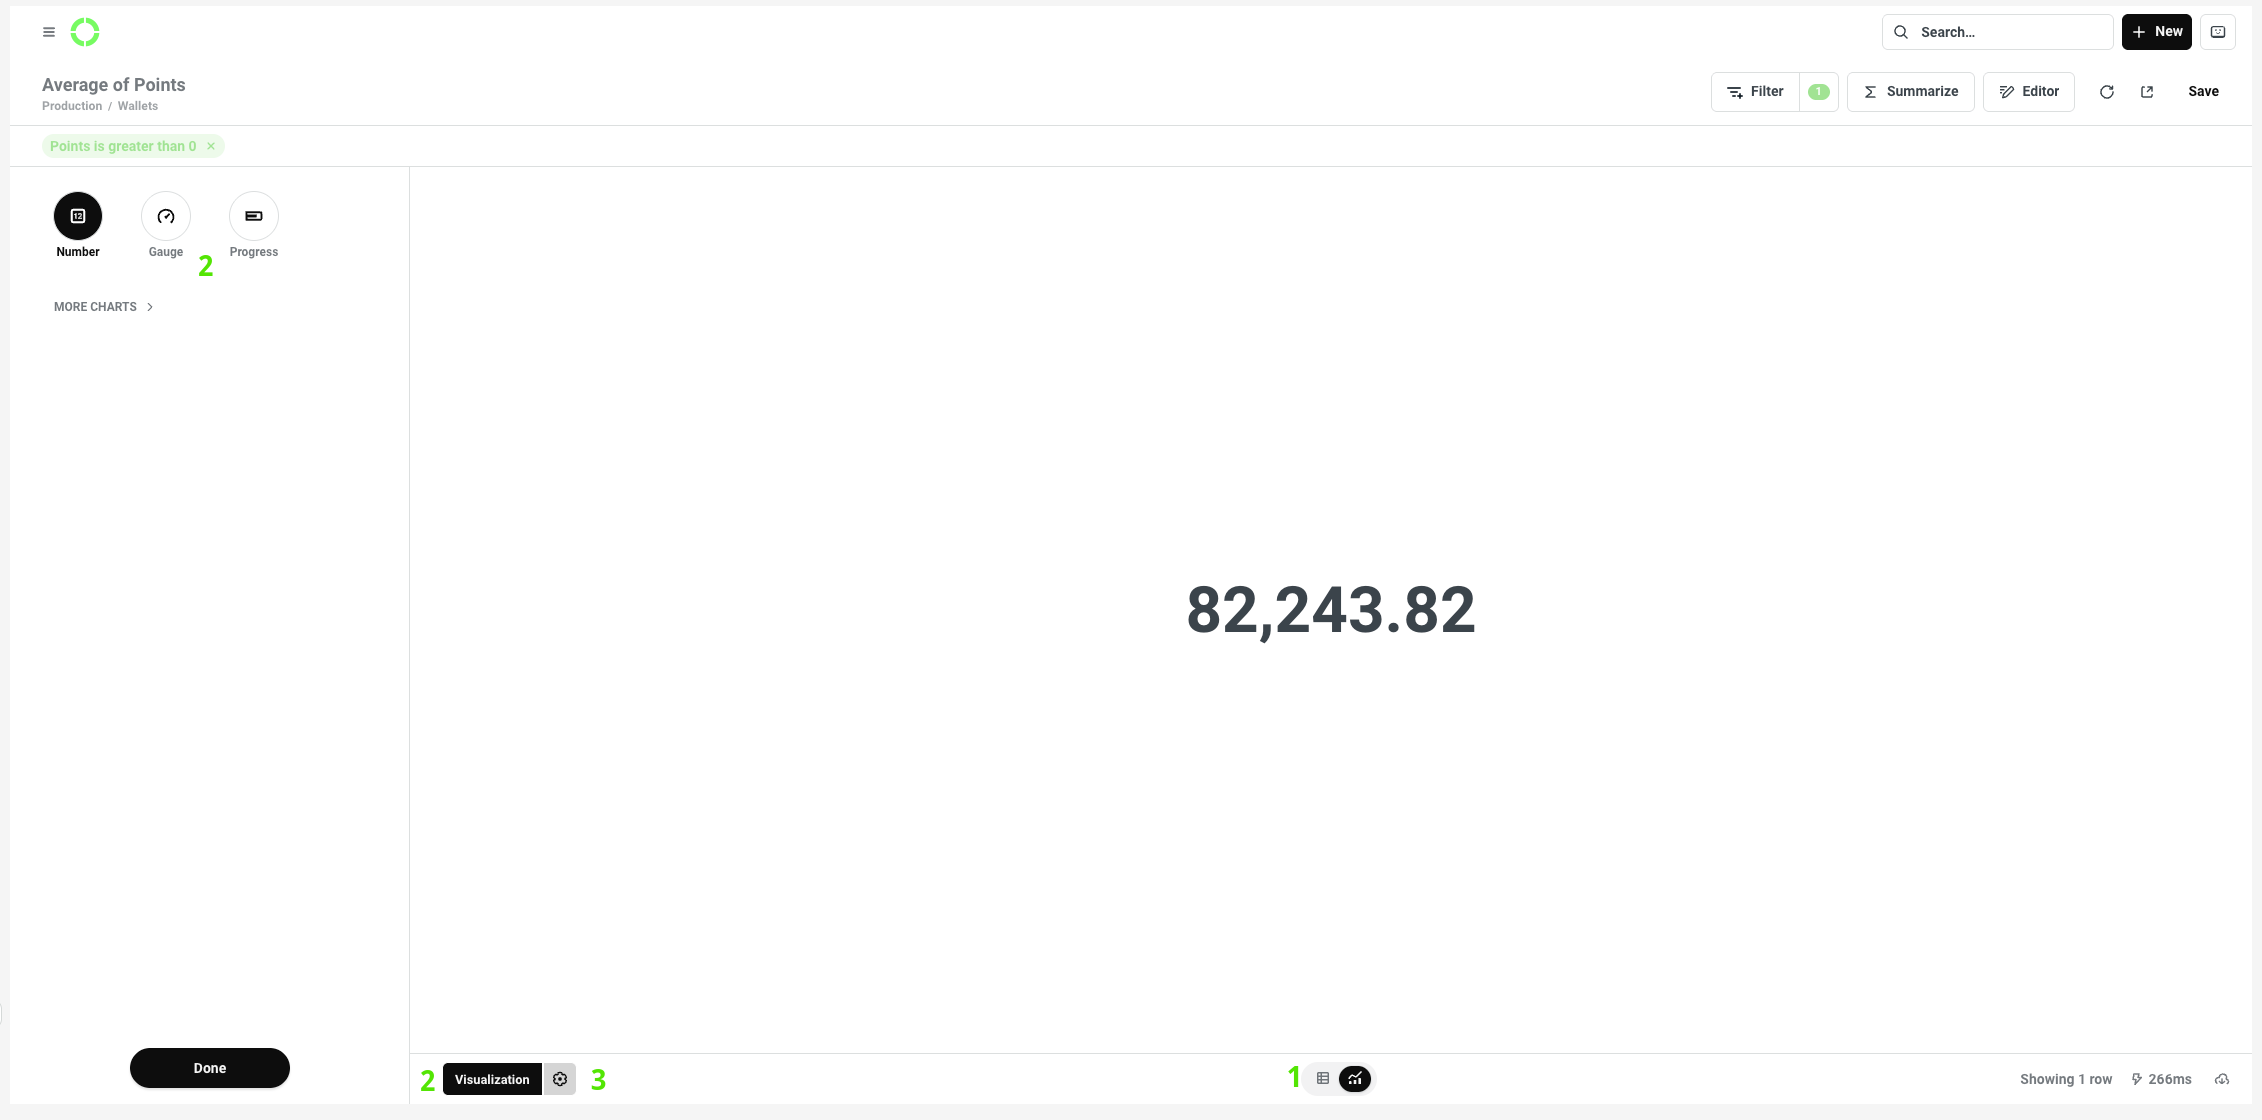
Here you can adjust visual and display settings:
1 - change chart to table2 - select a chart type (Visualization)3 - by clicking the cog ⚙️ you enter the: Data, Display, Axes options
Once done, click Save in the top-right corner.
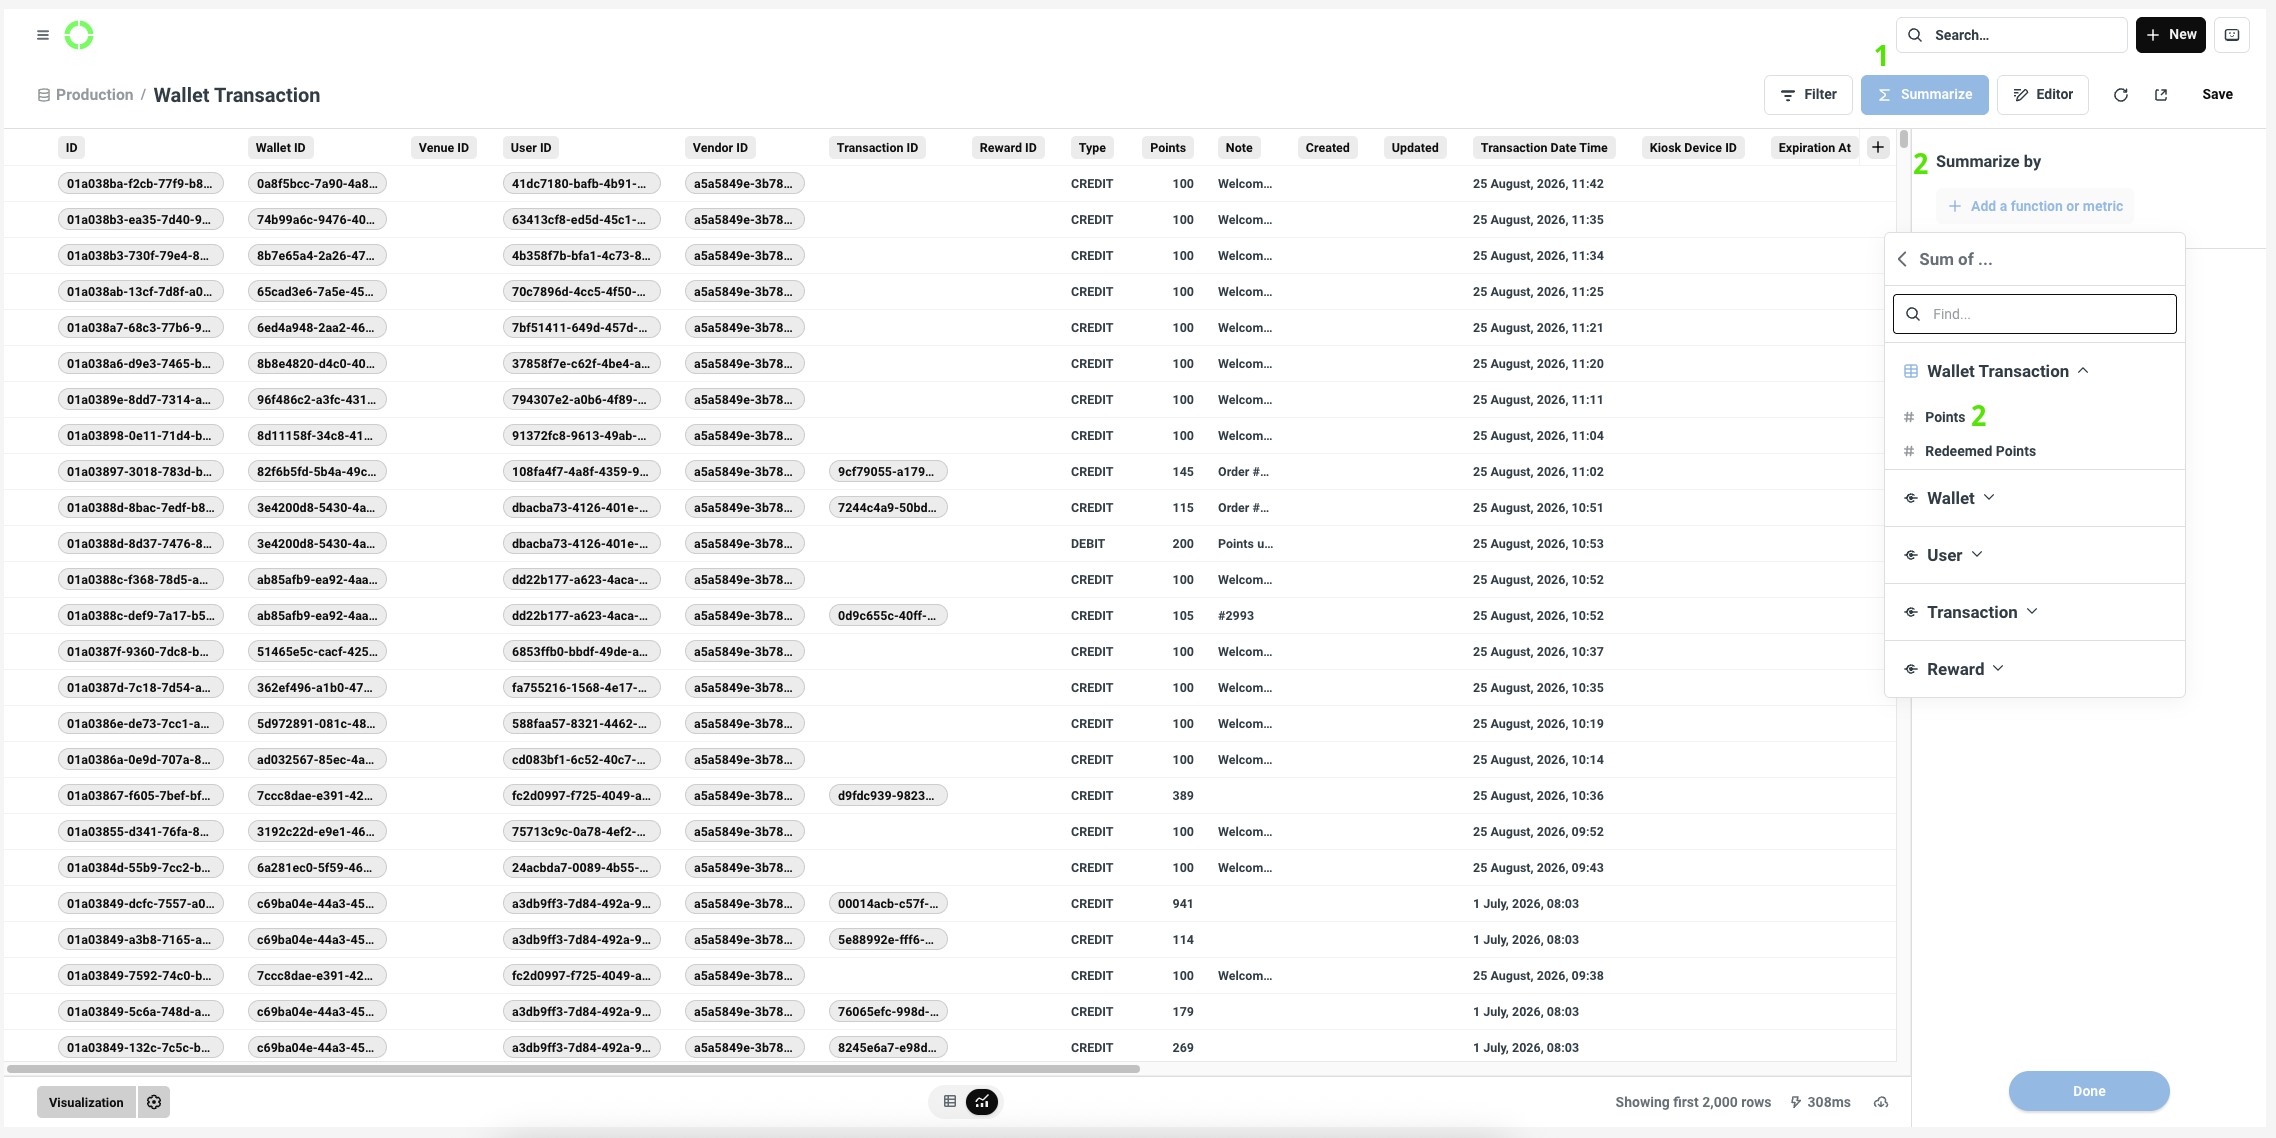
Points earned/burned:
To create a Questions go to Analytics > Databases > Production > Wallet Transaction
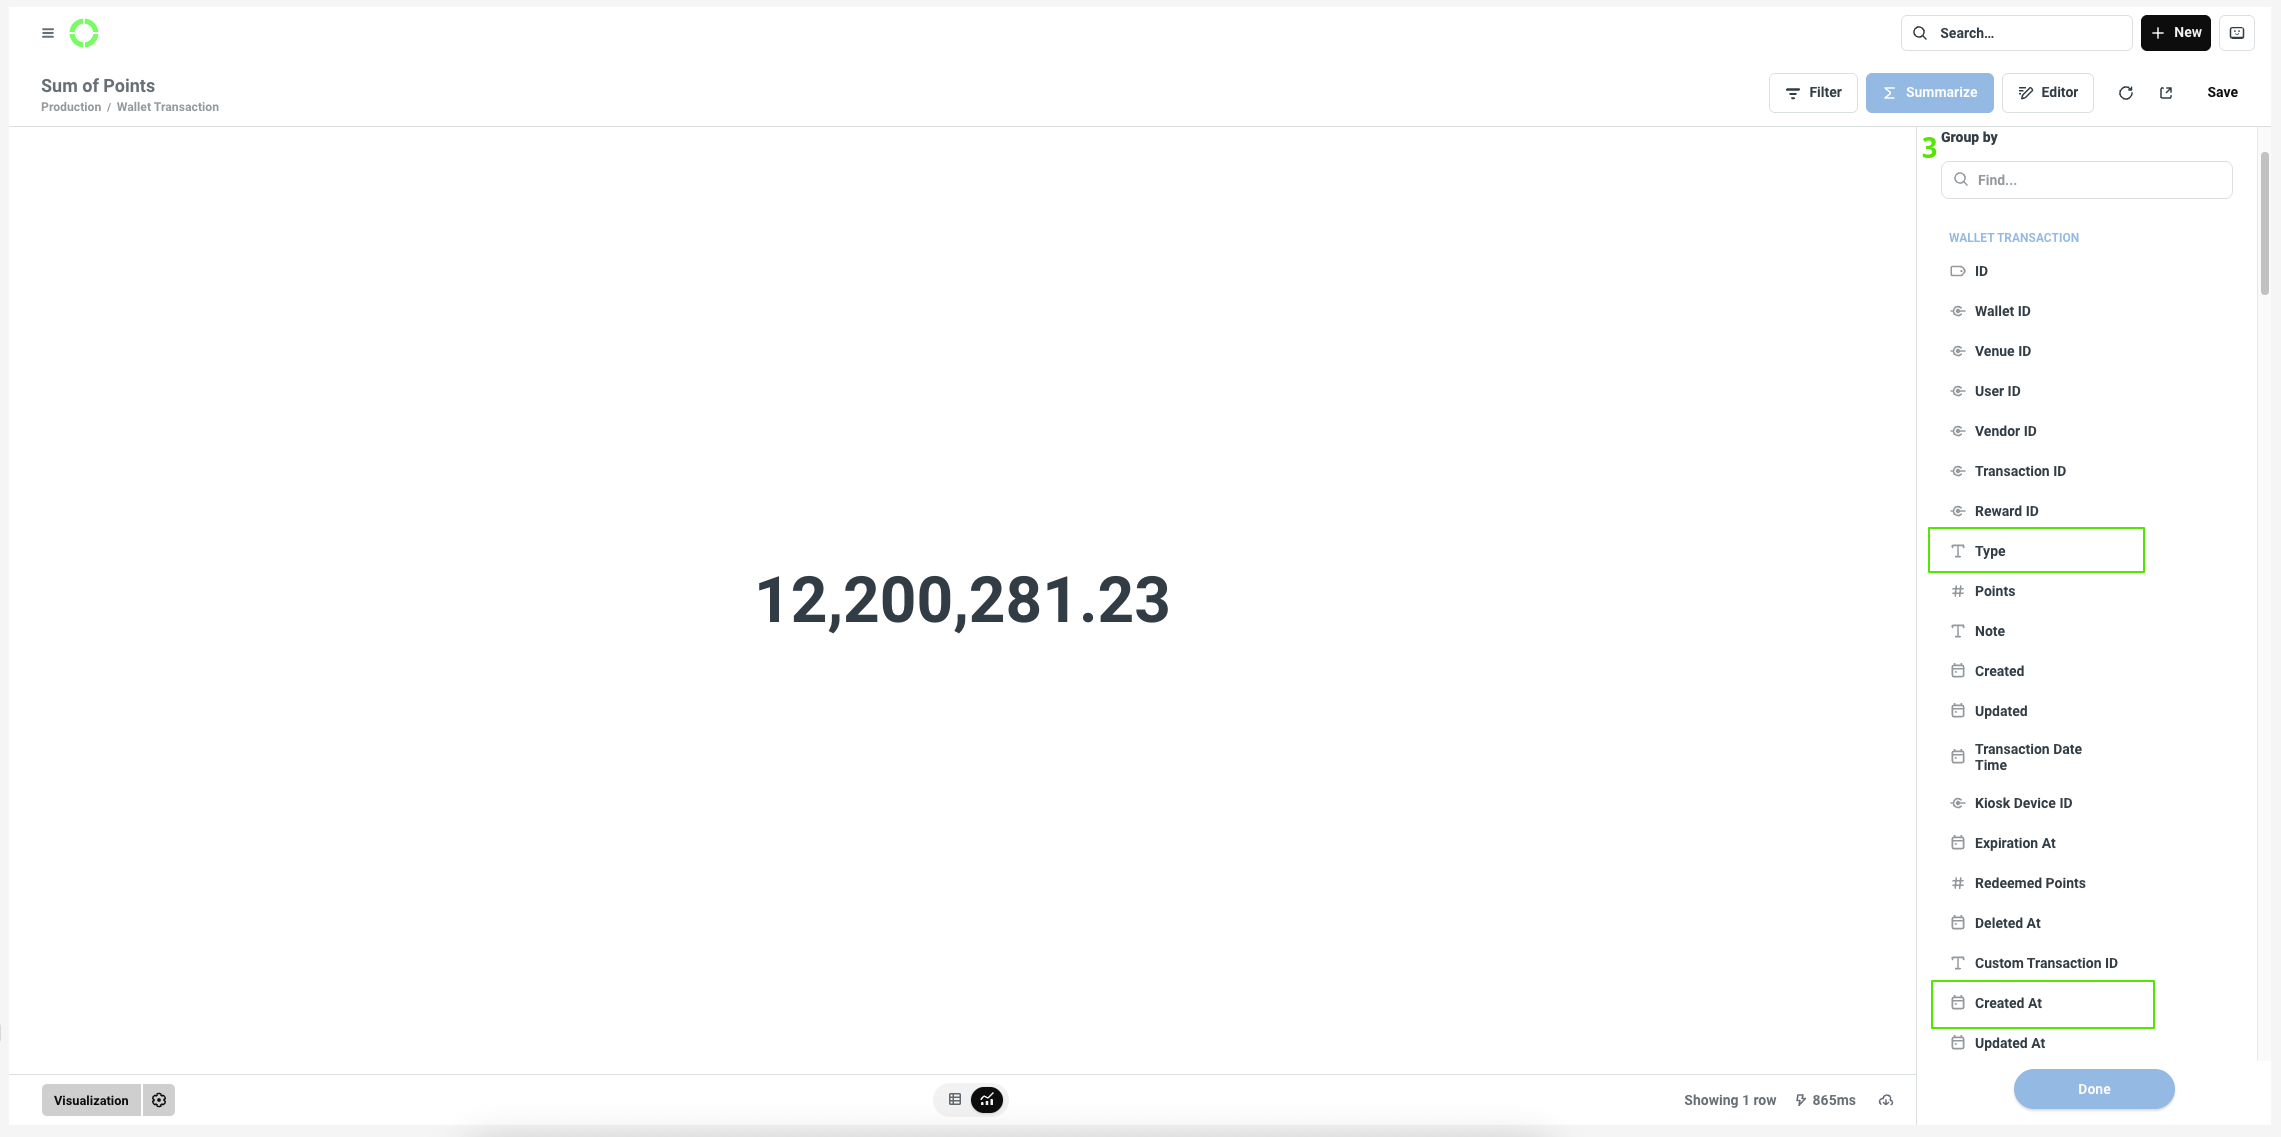
Click 1 Summarize and choose in Summarize by: 2 "Sum of Points", in Group by 3 "Type"&"Created At" (here you can choose to group it by: Minute, Hour, Day, Week, Month, Quarter, Year)
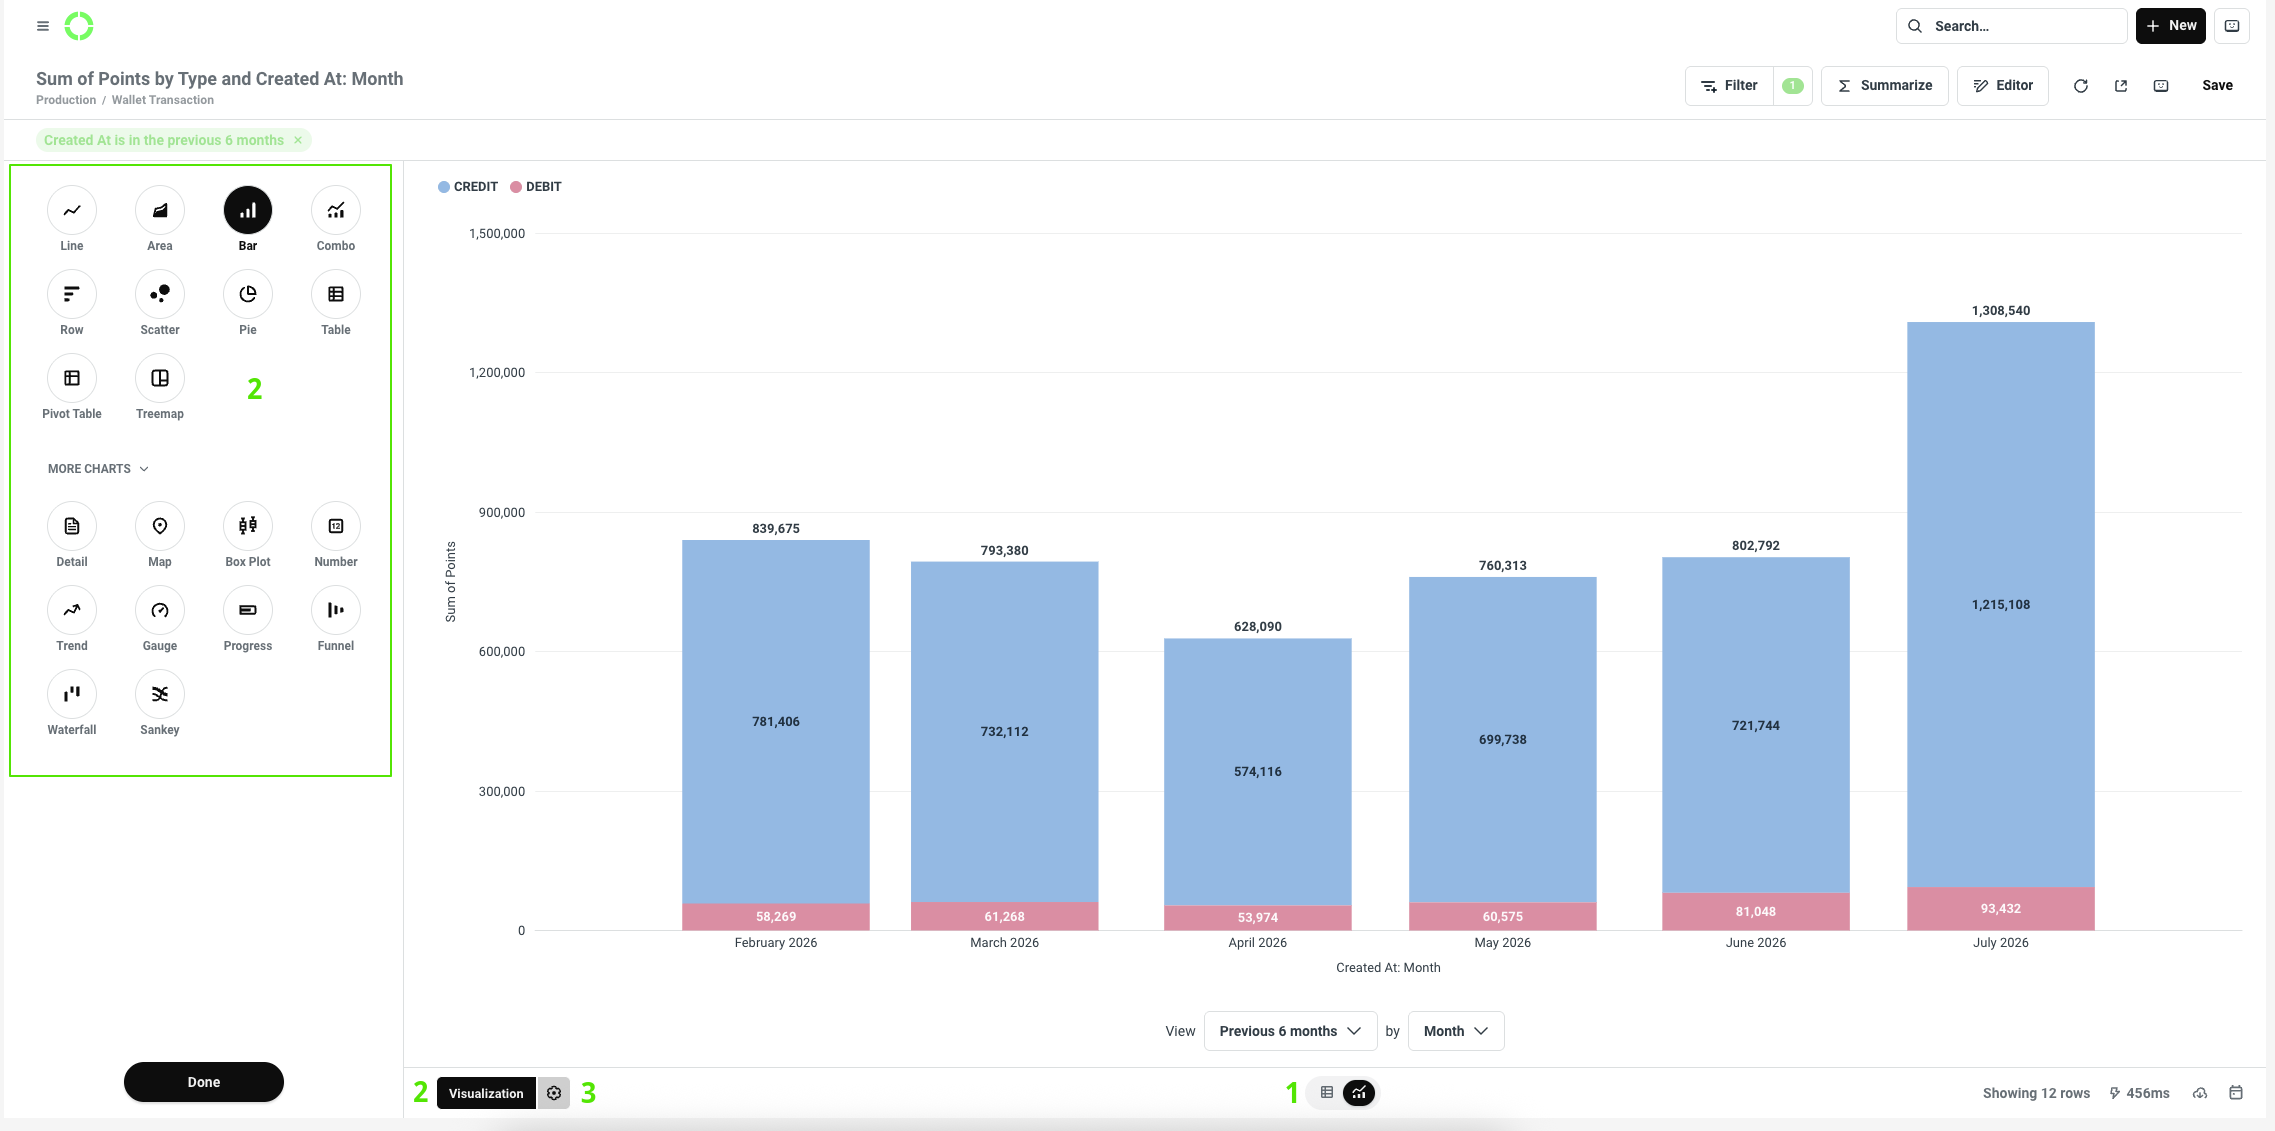
Here you can adjust visual and display settings:
1 - change chart to table2 - select a chart type (Visualization)3 - by clicking the cog ⚙️ you enter the: Data, Display, Axes options
Once done, click Save in the top-right corner.
Updated 12 days ago